Early Observations on the Pandemic and Population Density
It is still too early to draw precise conclusions on the extent to which the spread of the COVID-19 is related to urban population density. But there are important recurring themes. The following observations are made with the caveats that we are largely dealing with data inconsistent across geographies in terms of reporting and testing and preliminary. Rigorous research will have to await final data, which could be months in the future.
- Fundamentals of infection: There is broad consensus that the virus is spread person to person. The early conclusions has been to minimize the spread, “social distancing” of two meters was required. However, new research highlighted in the New England Journal of Medicine suggests that the virus can be airborne, apparently meaning that the risk of infection can be high much closer than two meters. (see “Aerosol and Surface Stability of SARS-CoV-2 as Compared with SARS-CoV-1” with appendices and “To mask or not to mask: WHO makes U-turn while US, Singapore abandon pandemic advice and tell citizens to start wearing masks.”)
- At whatever is the appropriate distance, the risk of infection is a function of being close to people who are infected.The most fundamental issue is thus, how close people are to one-another in their daily lives. The risk of infection can be expected to be higher where there are very high densities whether in residences, transport or employment locations.
- High density buildings (residential and employment) have characteristics that make social distancing virtually impossible. These include elevators, common hallways and generally larger numbers of people in close proximity. These factors seem likely to generate higher infection rates.There is no location in Canada or the United States with the extent of high density residential and employment that exists in New York City. These observations center on New York City and how its COVID-19 data compares to elsewhere.
- New York City has experienced a proportionately high share of infections and deaths from COVID-19. For example, according to the Johns Hopkins virus dashboard at 4:00 a.m. EDT on April 5, 312,000 infections were reported in the United States (cumulative). New York City had 63,000 infections, 20% of the US total. There were 8,500 deaths. New York City accounted for more than 30% of the deaths (2,600). These shares of the US figures are far higher than the City’s 2.6% of the US population.
- New York City’s high densities mean that residents and workers have no choice but to be in much closer contact with one another than in most areas of both the United States and Canada. With the caveats about preliminary and inconsistent data, the following observations are presented:
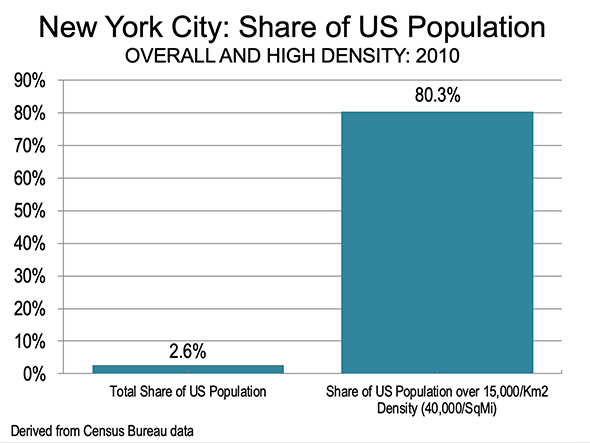
- New York City has the highest residential densities in the United States, with the highest census tract reaching over 80,000 per square kilometer (208,000 per square mile), according to 2010 US Census data. New York City has 80% of the population in the United States living in census tracts with densities above 15,000 per square kilometer (40,000 per square mile). This is more than 30 times the City’s 2.6% share of the US population (Figure).In contrast, the city of San Francisco is the second densest municipality over 500,000 in the United States, but its density is only 6,700 per square kilometer (17,300 per square mile). The city of Toronto has a density of 4,400 per square kilometer (11,200 per square mile) New York City has one of the largest and densest central business districts(CBD) in the world, in Manhattan. South of Central Park, the CBD has more than 1.9 million jobs, more than three times that of the Chicago CBD (570,000) and 5 times that of the Toronto and San Francisco CBDs (both 370,000).
- Crowded travel appears to be a major factor in spreading the virus. Airline, mass transit and intercity bus and rail travel typical carry passenger loads that make social distancing impossible. Based on the cruise ship experience, such as from the Diamond Princess in Tokyo, ventilation systems may spread the virus. Again, New York could be a special case:
- New York City has a very high transit commuting ratio (based on job location) and its central business district relies, of necessity, on mass transit access. More than 75% of commutes to the CBD jobs are by transit. This includes rail services, such as the New York City and PATH subways, commuter lines from Long Island, the Hudson Valley, southwestern Connecticut, and New Jersey, as well as buses. Rail riders must use stations that have much higher passenger volumes than is typical for bus stops. This would seem to increase exposure to infection. In New York, transit services are crowded during rush hour, making sufficient social distancing impossible.
- Again, with the caveats above, the latest data from Johns Hopkins indicates comparatively high infection and death counts in the suburban counties nearby New York City, which have the most intense use of commuter rail systems, although themselves not particularly dense. Nassau County, with its Long Island Railroad services feeding busy Penn Station, had 13,300 infections. To the east, Suffolk County is 50 km from Penn Station and had 11,400 infections.
- Westchester County, the closest county to Grand Central Station (via the Metro-North Railroad) had 13,100 infections. Farther out on the Metro-North the Connecticut counties of Fairfield and New Haven had considerably fewer infections (2,800 and 1,000 respectively). These counties have far lower densities and a far lower share of commuters on the rail lines. Their populations are similar to that of Westchester County (850,000 to 1,000,000.
- At the same time, the nearer suburban counties of New Jersey, served New Jersey Transit commuter rail had considerably lower rates of infection. No immediate cause for this difference is apparent.
- Other large urban counties around the US tend to have much lower infection numbers than Nassau, Suffolk and Westchester counties. Dispersed and heavily suburbanized Los Angeles County, with more than six times as many people as Nassau and Suffolk (1.4 to 1.5 million), had only 5,300 infections. Harris County (Houston), and Maricopa County (Phoenix), both with triple the population had 1,300 and 1,100 respectively.
- Even Cook County (Chicago), without the extensive high density of New York City and with a smaller transit share had 7,200 infections. Even so Cook County’s Chicago Transit Authority El and the downtown oriented commuter rail services carry substantial loads, but to a much smaller CBD than Manhattan (570,000).
- Obviously, social distancing is easier to accomplish in residential areas with a post-World War II urban form, especially with its largely ground oriented housing (detached house, semi-detached house or townhouse). Ground oriented housing requires no elevators and no common hallways. The lower population densities allow people to maintain sufficient social distances as they travel to and from destinations outside the home. Ryerson University’s Centre for Urban Research and Land Development has published considerable research detailing the cost controlling potential of ground oriented housing in the Greater Toronto Area. The suburban areas of Toronto, Los Angeles, San Francisco and San Jose are more than twice that of average American suburban areas. Despite high suburban densities that make the Los Angeles urban area (population centre) the densest in the United States, 30% denser than the New York urban area (2010 US Census data)
- New York City has a very high transit commuting ratio (based on job location) and its central business district relies, of necessity, on mass transit access. More than 75% of commutes to the CBD jobs are by transit. This includes rail services, such as the New York City and PATH subways, commuter lines from Long Island, the Hudson Valley, southwestern Connecticut, and New Jersey, as well as buses. Rail riders must use stations that have much higher passenger volumes than is typical for bus stops. This would seem to increase exposure to infection. In New York, transit services are crowded during rush hour, making sufficient social distancing impossible.
- Air travel may increase infection during pandemics, because people are so close together. New York is one of the world’s largest airline gateways. Infections brought into local areas by air travelers, both domestic and international seem to have been an important source of the spread.
- Conclusion: Clearly, social distancing must be observed, and perhaps even to a greater extent than we were originally told. When all of the data is in, let us hope not before long, it seems likely that extremely high densities and crowded travel conditions will be clear and determinative factors. There also could be other factors. And, again, the numbers so far are preliminary and inconsistent, and will require much greater study.

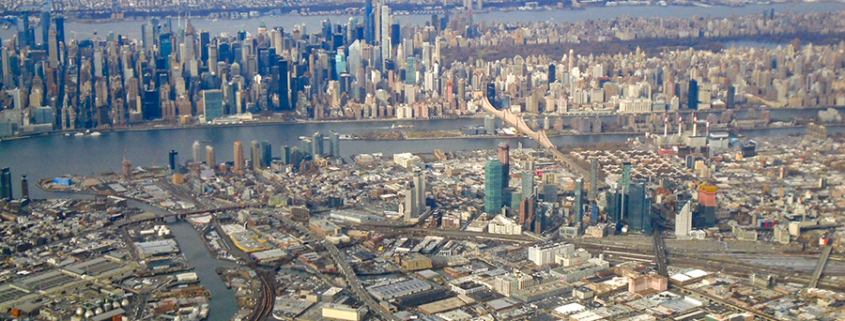
Photograph: New York – Left: Mid-town Manhattan, Right: Central Park, Upper East Side and Upper West Side, Foreground: Queens: Long Island City, by author
Wendell Cox is principal of Demographia, an international public policy and demographics firm. He is a Senior Fellow of the Urban Reform Institute – formerly Center for Opportunity Urbanism (US), Senior Fellow for Housing Affordability and Municipal Policy for the Frontier Centre for Public Policy (Canada), and a member of the Board of Advisors of the Center for Demographics and Policy at Chapman University (California). He is co-author of the “Demographia International Housing Affordability Survey” and author of “Demographia World Urban Areas” and “War on the Dream: How Anti-Sprawl Policy Threatens the Quality of Life.” He was appointed by Mayor Tom Bradley to three terms on the Los Angeles County Transportation Commission, where he served with the leading city and county leadership as the only non-elected member. Speaker of the House of Representatives appointed him to the Amtrak Reform Council. He served as a visiting professor at the Conservatoire National des Arts et Metiers, a national university in Paris.


