 Public Domain
Domestic Migration to Dispersion Accelerates (Even Before COVID)
In what could turn out to be a “dry run” for the post-COVID19 era, net domestic migration has strongly shifted away from the larger metropolitan areas, to smaller areas. This “sea-change” has occurred since 2015, according to the latest Census Bureau estimates. Domestic migration is reported by the Census Bureau when a resident or household moves from one US county to another (No migration below the county level is reported in Census Bureau population estimates). The era of big metropolitan area domination, so widely proclaimed by pundits, planners and academics, may be coming to an end.
The new data shows that the major metropolitan areas (over 1,000,000) population, have seen their annual net domestic migration plummet from an annual gain of 68,000 from 2010 to 2015 to an annual loss of 167,000 from 2015 to 2019 (Figure 1). We recently reported that within the major metropolitan areas, migration has increased strongly from the central to suburban counties. At the same time, smaller metropolitan and micropolitan areas (referred to as MSA’s in this article) and other areas have improved their net domestic migration categories (Note 1).Unlike in the past, MSAs and areas outside MSAs are doing much better. Some of these are in the smallest population categories and are outside the retirement communities that have attracted so many new residents, principally in Florida.

The strongest net domestic migration performance is in the metropolitan areas with from 500,000 to 1,000,000 population, nearly matched by those with from 100,000 to 500,000 population. Both categories have experienced big gains in net domestic migration from earlier in the decade. Neither did nearly as well in the recent past.
Metropolitan areas with from 50,000 to 100,000 population, which hemorrhaged residents for years, have also improved and have begun to gain net domestic migrants. The smallest metropolitan areas (under 50,000) and areas outside metropolitan areas (Note 2) are still suffering modest losses, but doing much better than earlier in the decade. Both of the smallest categories are also attracting hundreds of thousands more in net domestic migrants than the major metropolitan areas (Figure 2).

There has also been a substantial increase in the percentage of MSA’s below the major metropolitan category that gained domestic migrants from 2015 to 2019, compared to 2010 to 2015 (Figure 3).

Overall Leaders and Losers
The ten leading net domestic migration leaders from 2015 to 2019 (out of a total of 926) exclude all MSAs with more than 500,000 population. The Villages, Florida had the strongest net domestic migration, with a 4.5 percent annual addition to its population in 2015-2019. Summaries for each of the population categories are below.
The top ten is dominated by retirement areas and MSAs within or adjacent to combined statistical areas (CSAs). All ten are in the South or West (Figure 4).The MSAs with the largest domestic migration losses are in all four Census Regions, with the largest loss in Liberal, KS (Figure 5).


Major Metropolitan Areas (over 1,000,000 Population)
Austin continues to have the strongest net domestic migration among the major metropolitan areas, at 1.68% annually from 2015 to 2019 (2015 base). All but two of the top ten were in the South, which were joined by Las Vegas and Phoenix from the West. Seven of the top 10 had higher annual net domestic migration in 2015-2019 than in 2010-2015 (Figure 6).

In contrast, the bottom 10 had larger net domestic migration losses in 2015-2019 than in 2010-2015. The biggest losses were in San Jose, New York, Chicago, Los Angeles and Miami. The five densest major urban areas, as defined by the US Census Bureau are within the boundaries of this bottom ten (Los Angeles, San Francisco, San Jose, New York and Miami).
500,000 to 1,000,000 Population
Five of the six leading gainers in the 500,000 to 1,000,000 category were in Florida (North Port-Sarasota, Lakeland, Cape Coral, Deltona-Daytona Beach and Palm Bay). Nine of the top ten had more annual net domestic migration than in 2010-2015. A number of the top gainers are known as strong retirement communities, such as North Port-Sarasota and the other Florida metropolitan areas. Two of these MSAs are included in the Orlando CSA (Lakeland and Deltona-Daytona Beach), also indicating the spreading of growth from the core metropolitan areas, while North Port-Sarasota is within 90 minutes of the Tampa-St. Petersburg urbanization (Figure 7).

Boise Spokane, Fayetteville (AR) and Charleston (SC) are diversified MSAs that seem well positioned for continued growth. Two have particularly strong commercial bases, Fayetteville, headquarters of the world’s largest retailer (Wal-Mart) and Charleston with the Boeing Assembly plant, although this could suffer from the current aerospace depression. Nine of the top 10 had higher annual net domestic migration in 2015-2019 than in 2010-2015.
Nine of the bottom 10 had had larger net domestic migration losses in 2015-2019 than in 2010-2015. The largest losses were in Honolulu, Bridgeport-Stamford, Syracuse, El Paso and New Haven (with the two Connecticut MSAs in the New York CSA).
100,000 to 500,000 Population
The 100,000 to 500,000 category gainers are strong retirement destinations, such as The Villages, FL, Myrtle Beach, SC, Punta Gorda, FL, St. George, UT and Homossassa Springs, FL. Coeur d’Alene is in the Spokane CSA and Greeley, CO is in the Denver CSA. Nine of the top 10 increased their domestic migration in comparison with 2010-2015 (Figure 8).

Nine of the bottom 10 had had larger net domestic migration losses in 2015-2019 than in 2010-2015. Manhattan, KS and Watertown, NY had the largest losses, at over 2%.
50,000 to 100,000 Population
Unlike the other categories, the domestic migration gainers in the 50,000 to 100,000 category are not principally retirement destinations. Eight of the top ten are either in or close to CSAs, as metropolitan dispersion continues. The largest gainers were #1 Jefferson, GA (Atlanta CSA), #2 Granbury, TX (Dallas-Fort Worth CSA), #3 Fernley, NV (Reno CSA) and #5 Shelton, WA (Seattle CSA). My interest in demographics began in my youth in Shelton, which had experienced little growth then (Photograph above).
In addition, #7 Centralia WA is in the Seattle CSA and #9 Heber UT is in the Salt Lake City CSA. Three others are all within 90 minutes to reach Seattle CSA urban amenities: #6 Port Angeles, WA and #8 Aberdeen, WA (Figure 9). Cedar City, UT (#4) and #10 Statesboro, GA are the only ones not within or near a CSA. Nine of the top 10 had higher annual net domestic migration in 2015-2019 than in 2010-2015.
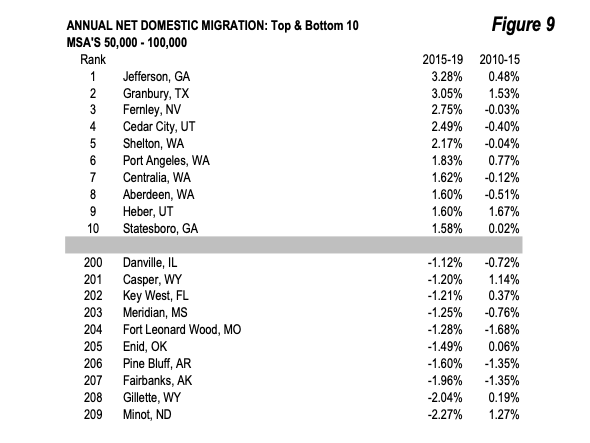
Nine of the 10 largest losses were greater in the later period than in the earlier. Minot, ND and Gillette, WY had the largest losses, both over 2%.
MSAs Under 50,000
The Pacific Northwest dominates the category with six of the top ten positions in the smallest MSAs. Four are in Oregon, led by Prineville and followed by #5 Newport, #7 Brookings and #9 Astoria. The other two Northwest entries are #3 Sandpoint, ID and #4 Ellensburg, WA, the latter within 90 minutes of the Seattle CSA urbanization.
Three of the top ten are in CSAs, including #6 Lewisburg, TN (Nashville CSA), #8 Bonham, TX (Dallas-Fort Worth CSA) and #10 Los Alamos, NM (Albuquerque CSA). The last, #2 Pahrump, NV, within 90 minutes of Las Vegas casinos and shopping. Each of the top 10 had higher annual net domestic migration in 2015-2019 than in 2010-2015.
All of the bottom 10 had had larger net domestic migration losses in 2015-2019 than in 2010-2015. Liberal, KS, Fort Polk South, LA and Guymon, OK had the largest losses, each at 3% or more (Figure 10).

Increasing Constituency for Exurbanization?
Such a quick switch of growth from the major metropolitan areas to smaller MSAs and non-MSAs is unprecedented. With the greater interest in working from home, as a result of virus related lockdowns, the dispersion may well become substantially greater as we move from the large metro age to “the city of bits”.
Note 1: Labor markets are designated by the Office of Management and Budget (OMB), using cross-county commuting patterns. These include metropolitan areas, which have a core urban area (built up urban area) of at least 50,000 residents and micropolitan areas, which have a core urban area of between 10,000 and 50,000 residents. In 2019, metropolitan areas varied in population from 55,000 (Carson City, NV) to nearly 20 million (New York, NY-NJ-PA).Micropolitan areas varied from 13,000 (Lamesa, TX) to 217,000 (Lebanon, VT-NH). Metropolitan areas and micropolitan areas be “combined statistical areas” (CSAs), designated by OMB, using less stringent commuting criteria.
Note 2: Areas outside MSAs should not be confused with “rural” areas. All MSA’s, including the major metropolitan areas, cover far more rural land than urban land, though their populations are predominantly urban (See: “The Rural Character of America’s Metropolitan Areas”). As a result, metropolitan area population densities cannot be used as urban densities, because they include rural densities.
Photograph: Shelton, Washington, one of the many smaller “turnaround” domestic migration MSAs. This photograph includes the Rayonier Corporation’s 375 foot smokestack, which was reputedly the second tallest in the world when built, and dismantled in 1967. Source: Good Free Photos, under Public Domain
Wendell Cox is principal of Demographia, an international public policy and demographics firm. He is a Senior Fellow of the Urban Reform Institute – formerly Center for Opportunity Urbanism (US), Senior Fellow for Housing Affordability and Municipal Policy for the Frontier Centre for Public Policy (Canada), and a member of the Board of Advisors of the Center for Demographics and Policy at Chapman University (California). He is co-author of the “Demographia International Housing Affordability Survey” and author of “Demographia World Urban Areas” and “War on the Dream: How Anti-Sprawl Policy Threatens the Quality of Life.” He was appointed by Mayor Tom Bradley to three terms on the Los Angeles County Transportation Commission, where he served with the leading city and county leadership as the only non-elected member. Speaker of the House of Representatives appointed him to the Amtrak Reform Council. He served as a visiting professor at the Conservatoire National des Arts et Metiers, a national university in Paris.
 Dhanix, used under CC 3.0 License