Greater Los Angeles Area Growth Tanking and Dispersing
For decades, there has been substantial dispersion of population in Greater Los Angeles (Los Angeles combined statistical area or CSA), as the suburban areas outside the urban core have dominated population growth. The latest population estimates by the US Census Bureau confirm the continuation of that trend. But something has changed. In recent years the Los Angeles CSA has experienced an unprecedented slowing of growth. The little growth has occurred has been dispersed away from coast, especially from Los Angeles and Orange counties to inland Riverside and San Bernardino counties. Indeed. Between 2017 and 2018, Riverside and San Bernardino counties, farther from the Los Angeles urban core than Orange and Ventura counties, accounted for all of the population growth of Greater Los Angeles.
The Los Angeles CSA is the broadest definition of the local labor market, as defined by the White House Office of Management and Budget. It includes the Los Angeles metropolitan area (Los Angeles and Orange counties), the Riverside-San Bernardino metropolitan area (Riverside and San Bernardino counties) and the Oxnard metropolitan area (Ventura County). Commuting trends between these metropolitan areas are strong, and the basis of the CSA’s formation.
Population Growth
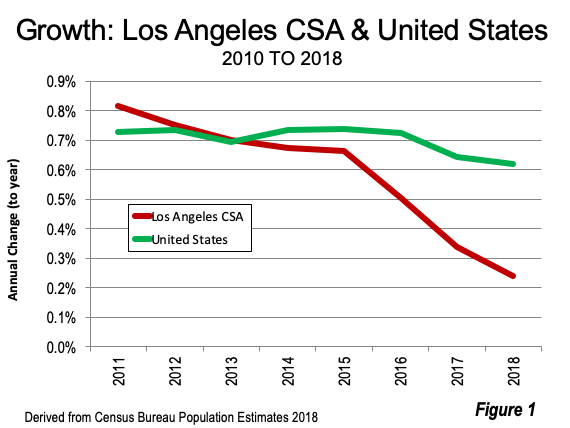
In the first year of the decade (2010 to 2011), the Los Angeles CSA had a population growth of 0.82%, nearly a 10th of percentage point higher than the national rate of 0.073%. The Los Angeles growth continued above the national rate through 2012 though declined in both years. Since that time, growth has virtually tanked, with 2017 to 2018 population growth falling to 0.024%, more than 60% below the declining national rate of 0.062% (Figure 1). Between 2010 and 2011, the Los Angeles CSA gained 146,000 residents but only 45,000 residents between 2017 and 2018. Over the last year, the Los Angeles CSA added fewer new residents than the state of Utah, which has only one-sixth the population.
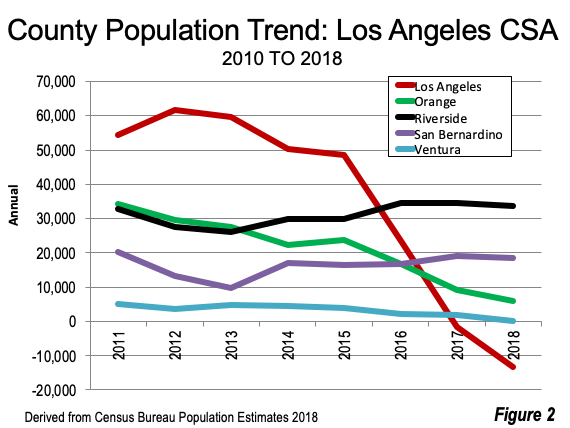
Much of the decline has occurred in Los Angeles County. For the first five years of the decade (2010 to 2015), Los Angeles County population grew an average of 55,000. Then growth tanked, with fewer than 3,000 new residents added annually from 2015 to 2018, and declines in 2017 and 2018. This loss led the Los Angeles metropolitan area (Los Angeles and Orange counties) into decline in 2018. The nation’s two other largest metropolitan areas, New York and Chicago also lost population. Between 2010 and 2015, Los Angeles County accounted for 42% of the CSA growth, but fell more than 90% between 2015 and 2018. Between 2010 and 2018, Los Angeles Country grew only 2.9%.
However, things were only marginally better in coastal Orange County. Orange County grew 34,000 in 2010-2011, but by 2017-2018 had an increase of only 6,000. Orange County grew 5.6% between 2010 and 2018. Ventura County, along the coast to the west of Los Angeles County experienced a similar trend, with much smaller numbers. Ventura County gained 5200 residents in 2010-2011, but by 2017-2018 grew by only 200. Ventura County’s eight-year growth was 3.1%, almost as slow as that of Los Angeles County.
The Inland Empire counties of Riverside and San Bernardino had by far the strongest growth. Riverside County grew between 26,000 and 35,000 each year and grew 11.3% between 2010 and 2018. Growth was somewhat slower in San Bernardino County, which started with growth of 21,000 in 2011, dropped somewhat and finished in 2018 within 18,000 gain. San Bernardino County gained 6.4% from 2010 to 2018 (Figure 2). In 2010 – 2011, the two Inland Empire counties accounted for 36% of the CSA growth. By 2018, they accounted for 116% of the CSA growth, as the total population declined in the three coastal counties.
Domestic Migration: Half a Million More Left than Came
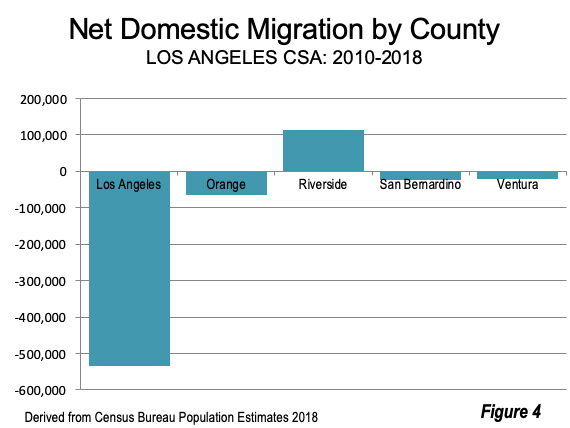
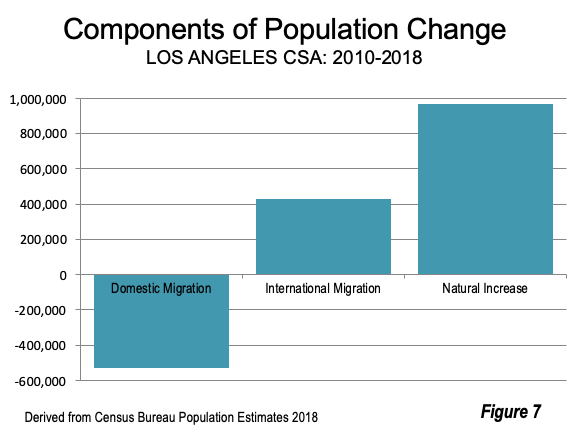
The Los Angeles CSA has experienced negative net domestic migration for most of the past two decades, a trend that continued in every year between 2010 and 2018. In 2010 – 2011, there was a net domestic migration loss of 37,000, which expanded to a minus 102,000 in 2017 – 2018. There was an overall net domestic migration of 529,000 since 2010. Los Angeles County lost 534,000 (Figure 3).
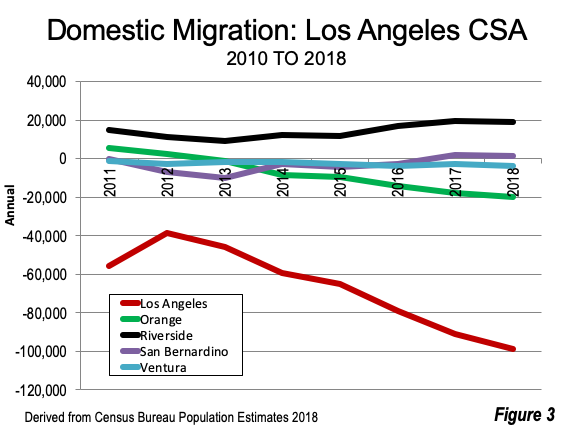
Four of the five counties experienced net domestic migration losses between 2010 and 2018, with only Riverside County posting a gain (114,000). Orange County had small gains in the first two years but has lost ever since, with an 18,000 loss in 2018. Overall Orange County had a net domestic migration loss of 64,000 since 2010. Ventura County lost during each year and had a final net domestic migration loss of 21,000. San Bernardino County lost 24,000 between 2010 and 2018, but by the end of the period had small gains (Figure 4).
Strong International Migration
There was a gain in net international migration of 428,000, approximately making up for 80% of the domestic migration loss. Most of the gain (298,000) was in Los Angeles County. Orange County accounted for approximately two thirds of the 130,000 balance, with a gain of 86,000.
Natural Increase (Births Minus Deaths) Dropping Significantly
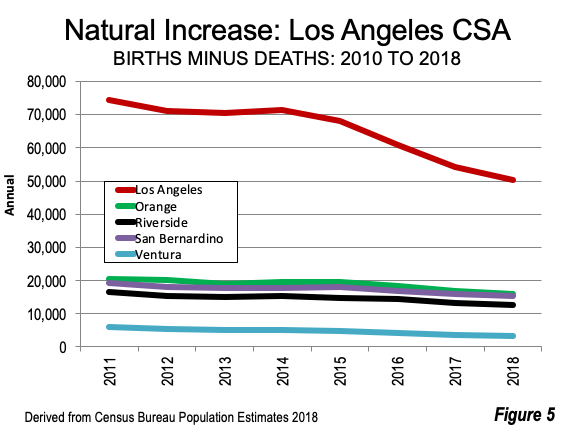
The annual natural increase in population has been declining. This measure, births minus deaths, dropped from 137,000 in 2010 – 2011 to 97,000 in 2017 – 2018, an overall decline of 29%. The decline in Los Angeles County was 32%. The largest decline was in Ventura County at 47%, and the lowest was in San Bernardino County at 19% (Figure 5).
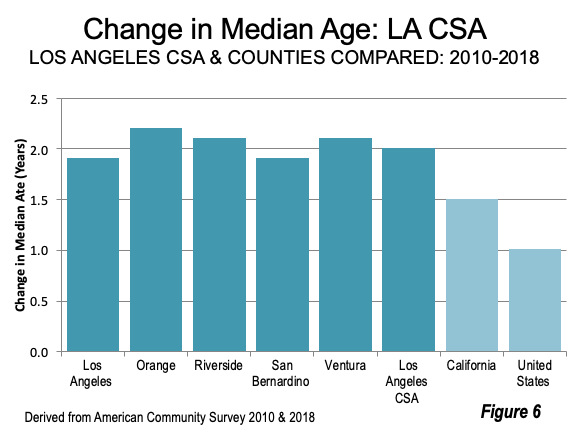
One of the most important reasons that the natural increase in population is slowing down is that the Los Angeles CSA is aging rapidly — with a median age that has doubled the national increase (Figure 6). The Los Angeles CSA is aging a full one-third faster than California as a whole. Other factors are contributing to this decline: There is the declining fertility rate, which is evident virtually everywhere in the nation. The substantial net domestic outmigration is also a factor. IRS data shows that California’s net domestic outmigration tends to be strongest among households from 26 to 44 years old, ages that produce most of the children. The slowest outmigration rate is among those aged 65 and over.
The components of Los Angeles CSA growth are illustrated in Figure 7.
Former Growing Los Angeles in Context
All of this adds up to a consequential reversal of the population growth that had characterized Greater Los Angeles, especially since 1950. The Los Angeles-Inland Empire urban area (which includes the continuous urbanization of Los Angeles, Orange, Riverside and San Bernardino counties) has grown by more than 11 million residents in the last seven decades (Note). Only Tokyo, Seoul and Osaka-Kobe Kyoto grew more among high-income world nations. At the same time, all of the first world urban areas larger than Los Angeles, these three and New York are doing less well than Greater Los Angeles in adding population.
Note: The continuous urbanization here is as reported in Demographia World Urban Areas. The growth since 1950 is estimated using data from Tertius Chandler, Four Thousand Years of Urban Growth: An Historical Census. Chandler’s work is generally considered the best on this subject.
Photograph: San Bernardino County: I-10/I-215 interchange at bottom, the city of San Bernardiono, Cajon Pass and, beyond the mountains, the Victor Valley. San Bernardino and Riverside counties (just to the south of the picture) had all of the population growth in Greater Los Angeles in 2017-2018.
Wendell Cox is principal of Demographia, an international public policy and demographics firm. He is a Senior Fellow of the Center for Opportunity Urbanism (US), Senior Fellow for Housing Affordability and Municipal Policy for the Frontier Centre for Public Policy (Canada), and a member of the Board of Advisors of the Center for Demographics and Policy at Chapman University (California). He is co-author of the “Demographia International Housing Affordability Survey” and author of “Demographia World Urban Areas” and “War on the Dream: How Anti-Sprawl Policy Threatens the Quality of Life.” He was appointed by Mayor Tom Bradley to three terms on the Los Angeles County Transportation Commission, where he served with the leading city and county leadership as the only non-elected member. Speaker of the House of Representatives appointed him to the Amtrak Reform Council. He served as a visiting professor at the Conservatoire National des Arts et Metiers, a national university in Paris.


