
College Graduates Concentrated in Suburbs, Highest Educational Attainment in CBDS
The nation’s high-density central business districts of the major metropolitan areas have the largest shares of adults over the age of 25 with bachelor’s degrees or higher, which is consistent with popular perception. At the same time, because such a small percentage of people live in the central business districts, by far the most bachelors degree and higher adults live in the suburbs.
This article examines educational attainment within the 53 major metropolitan areas (over 1,000,000 population) using the City Sector Model. The City Sector Model, which classifies small areas in US metropolitan areas based upon their function as urban cores, suburbs, or exurbs (Figure 9 and Note).
Overall data for the above 25 aged population is included as well as data for the four largest ethnicities, White Not Hispanic or Latino, African American, Asian and Hispanic or Latino. The data is the annual average for the five years of 2013 through 2017, which is from the American Community Survey 5-year data, which provides a statistically valid sample of the population for the nation at the small area level.
Overall
Overall, 35.6 percent of the population over 25 years of age has a four year degree or higher level of education (referred to as “college graduates” in this article). The balance of 64.4 percent have lower educational attainment (Figure 1). The City Sector Model Urban Core – Central Business District has the highest education attainment, with 66.1 percent of the population being college graduates. The Central Business Districts also have by far the highest population densities in the major metropolitan areas (Figure 2), more than double that of the Inner Ring and from nine to 17 times the densities of the Earlier and Later Suburbs. The Exurbs, which are overwhelmingly not urban (that is rural) have an even lower density.


The balance of the urban core (Inner Ring) has a college education rate at about the national average, at 36.0 percent. The Earlier Suburbs have a rate of 34.1 percent, the Later Suburbs 40.2 percent and the Exurbs are the lowest, at 28.1 percent.
However, the Central Business Districts have only 2.7 percent of the major metropolitan area college graduates, by far the lowest percentage of any city sector. By far the most college graduates live in the suburbs, more than 25 times as many as in the CBDs. The Inner Ring college graduate share was 13.4 percent, five times that of the CBD, while the Exurban share nearly as high, at 12.9 percent (Figure 3). Among the five sectors, the highest number of college graduates was in the Earlier Suburbs.

The distribution of college graduates among the four largest ethnicities is similar.
White Not Hispanic
The CBD’s had the highest share of White Not Hispanic college graduates, at 80.6 percent. The Inner Ring had the second highest share, at 54.9 percent, while the suburbs and exurbs had lower percentages (Table). As with the overall data, about 25 times as many college graduates live in the suburbs (70.1 percent) as in the CBDs. (2.8 percent). Exurbs had more graduates than the Inner Ring (Figure 4). Among the five sectors, the largest number of White Not Hispanic college graduates was in the Earlier Suburbs.

African American
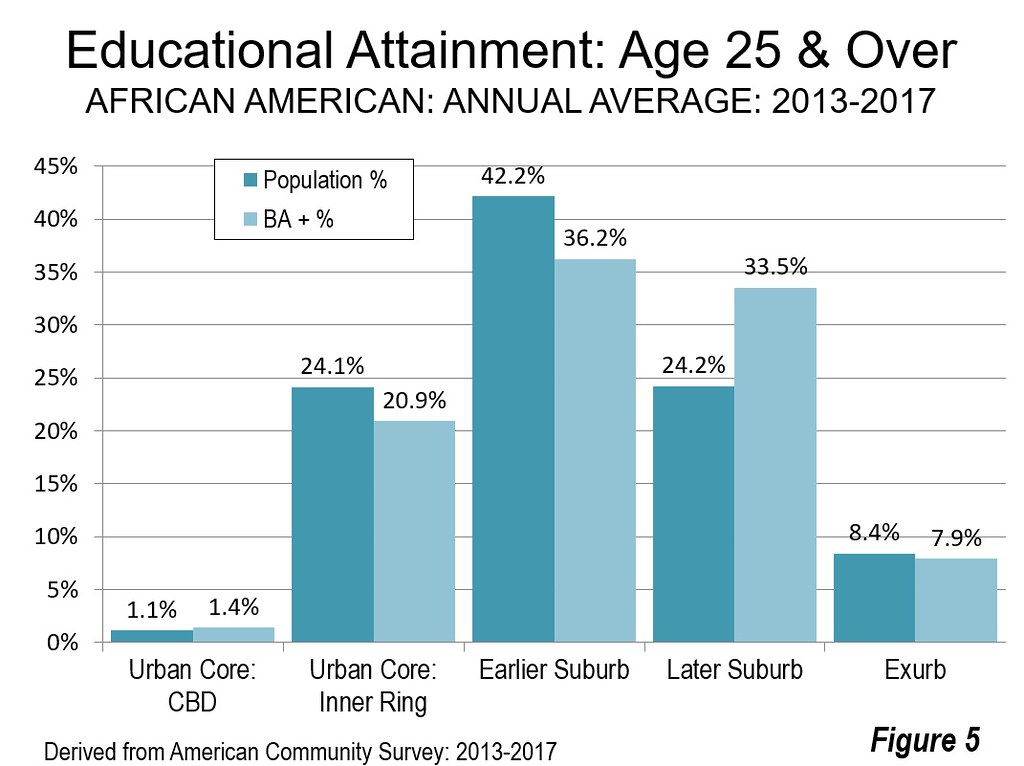
The only ethnic group to have its highest college graduate share outside the CBDs was African Americans, with 32.2 percent of those living in the Later Suburbs. This compares to the 29.3 percent of CBD residents with college degrees (Table). The largest number of college graduates among African Americans lived in the Earlier Suburbs (36.2 percent) and Later Suburbs (33.5 percent). The two suburban sectors (Figure 5) together had nearly 50 times as many (69.7 percent) African American college graduates as the CBDs (1.4 percent).
Asian
The Asian college graduate shares were the most constant across the metropolitan sectors. CBD residents had a 63.8 percent graduate rate, which was the highest. This compares to the lowest, in the Inner Ring, at 46.1 percent. As a result, Asians have the highest college graduation rate, at 54.7 percent (Table), more than one-third above that of White Not Hispanics. The suburbs had 20 times as many (75.4 percent) Asian college graduates as the CBDs (3.3 percent). The highest number of Asian college graduates (Figure 6) were in the Earlier Suburbs (42.2 percent).

Hispanic or Latino
As in all but one other ethnicity, Hispanic or Latino residents in the CBD’s had the highest college education rates, at 35.4 percent. Only in the Later Suburbs were the rates within one-half of the CBD percentage (Table). However, the number of Hispanic or Latino college graduates (Figure 7) in the suburbs were nearly 30 times that of the CBDs (2.5 percent).

Suburban Concentration
As Figure 8 shows, the total number of college graduates living in the suburbs from three to five times as high as in both of the urban core sectors (CBD and Inner Ring). Overall, the college graduate figure in the Exurbs is nearly as high as the urban core, and is higher among White Not Hispanics. The popular narrative of college graduates living in urban cores, especially the CBDs, surrounded by materially less well educated suburbs and exurbs is misleading.They may be more concentrated in the core, but the overwhelming majority lives in the suburbs and exurbs.


Note: The City Sector Model classifies small areas (ZIP codes, more formally, ZIP Code Tabulation Areas, or ZCTAs) in metropolitan areas in the nation based upon their function as urban cores, suburbs, or exurbs. The criteria used are generally employment and population densities and the extent of transit use versus car use (Figure 5). The purpose of the urban core sectors is to replicate, to the best extent possible, the urban form as it existed before World War II, when urban densities were much higher and a far larger percentage of urban travel was on mass transit. The suburban sectors replicate the automobile-oriented suburbanization that began in the 1920s and escalated strongly following World War II. The suburban areas are largely within the continuous built-up urban areas, while the exurban areas are generally in the metropolitan areas, but outside the built-up urban areas.
Wendell Cox is principal of Demographia, an international public policy and demographics firm. He is a Senior Fellow of the Center for Opportunity Urbanism (US), Senior Fellow for Housing Affordability and Municipal Policy for the Frontier Centre for Public Policy (Canada), and a member of the Board of Advisors of the Center for Demographics and Policy at Chapman University (California). He is co-author of the “Demographia International Housing Affordability Survey” and author of “Demographia World Urban Areas” and “War on the Dream: How Anti-Sprawl Policy Threatens the Quality of Life.” He was appointed to three terms on the Los Angeles County Transportation Commission, where he served with the leading city and county leadership as the only non-elected member. He served as a visiting professor at the Conservatoire National des Arts et Metiers, a national university in Paris.
Photograph: Southern Methodist University via Wikimedia under CC 4.0 License

