The Cities Doing the Most to Address the U.S. Housing Shortage
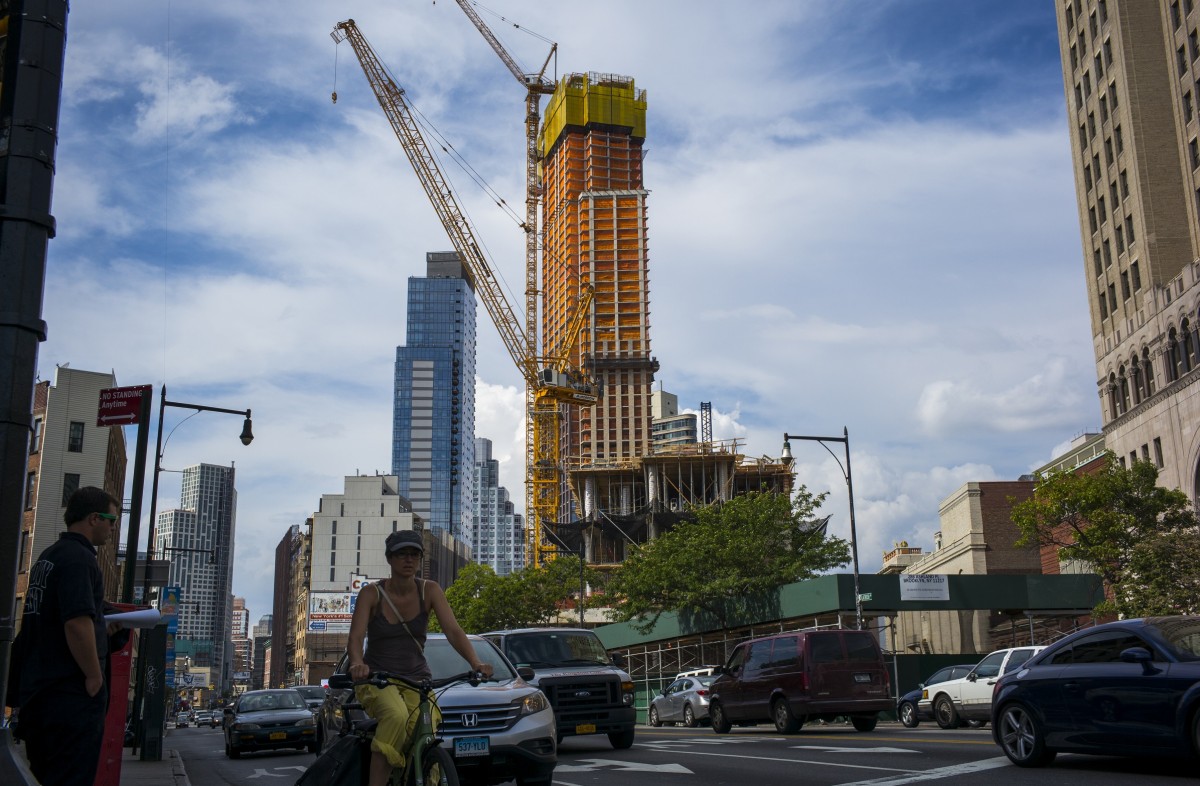
A woman bicycles past a 52-story apartment building under construction in downtown Brooklyn on Aug. 23. New York City is failing to increase its housing supply enough to meet demand. (Photo by Robert Nickelsberg/Getty Images)
By Joel Kotkin and Wendell Cox
America is suffering from the severest undersupply of housing since the end of the Second World War. Although population growth has slowed significantly since the 1950s and 1960s, production has slowed down even more so. It’s not surprising that homebuilding declined after the housing bubble burst in 2008, but from 2011 to 2015 it continued to fall, dropping almost a quarter.
Meanwhile, housing price inflation has re-emerged. Housing now accounts for roughly 35% of household expenditures, up from about 30% in 1985, while expenditures on food, apparel and transportation have dropped or stayed about the same.
High home prices help to boost rents by forcing potential buyers into the apartment market. As of midyear, rental costs were eating up the largest share of renters’ income in recent U.S. history, 30.2%. Since 1990, renters’ income has not increased, but rents have soared 14.7% (both inflation adjusted).
In high-priced markets like New York, Los Angeles, Miami and San Francisco, the average renters spend from 42% to 48% of their income on rent, well above the national average. In New York, rents increased between 2010 and 2015 by 50%, while incomes for renters between ages 25 and 44 grew by just 8%.
The Cities Building The Most New Homes
Some metropolitan areas are doing a much better job than others at meeting this pent-up demand by building new housing.
We looked at the volume of construction permits for single and multifamily units in the 53 largest metropolitan statistical areas in the country from 2011 through 2014, and compared them to those metro areas’ existing housing bases.
To a large extent, the superstars of the past four years have been those areas that have enjoyed both the greatest job and population growth. The top of our list of cities that are increasing their housing supply the most is dominated by metro areas that have generally better housing affordability, with a multiple of median incomes to median housing prices between three and four.
Leading the way is Austin, Texas, which issued permits for the construction of roughly 71,000 housing units from 2011 through 2014, equal to 11.5% of its existing housing base in 2010. Austin’s new construction was split almost 50-50 between single family and multifamily units.
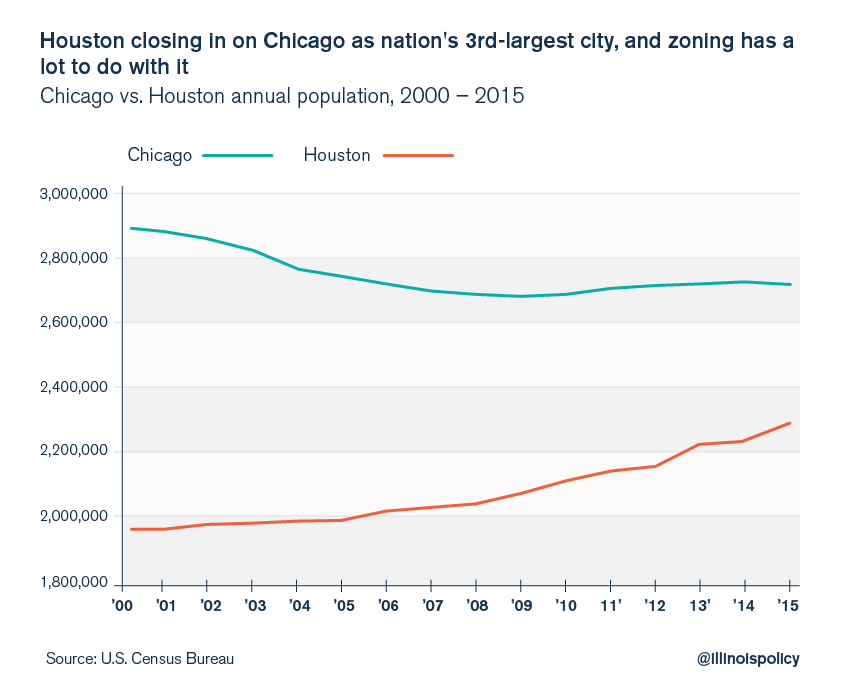
Other Texas cities in our top 10 include No. 3 Houston, which permitted the construction of 189,634 new units from 2011-14, the most in the nation over that span, equal to 9.7% of its 2010 base. Dallas-Ft. Worth ranks seventh, with a total of 148,329 units, second most in the nation behind Houston, for a 6.7% expansion of its housing supply from 2010. Most of the rest of our top 10 — including the North Carolina boom towns Raleigh (No. 2) and Charlotte (No. 4) — are located in or adjacent to the southern rim of the country. Only No. 10 Seattle can be considered a “smart growth” region, with the predictable high prices relative to incomes.
Families vastly favor single-family homes, and they can still find them at a relatively affordable price in many Southern cities. Some two-thirds of housing construction permits in Houston from 2011-14 was for single-family homes, and six of the top 10 metro areas for single-family construction over that span were located in the South. Houston alone produced nearly as many new single-family homes in 2014 as the entire state of California, which has about six times as many residents.
If you go by new single-family construction as a percentage of the existing housing base, sprawling, suburban, smaller and mid-sized metropolitan areas in the South are in the lead: Raleigh, Austin, Nashville, Charlotte, Orlando, Oklahoma City and Jacksonville.
Full List: The Cities Building The Most New Housing
But it’s important to recognize that as these areas “sprawl” they are also densifying. Houston ranks second nationally for new multifamily units over the span we looked at with 65,261; Austin, seventh (35,687, representing 18% of its 2010 base); and Charlotte ranks 15th. Some of this growth is concentrated near their urban cores, which have revived in recent years.
The Doyennes Of Density
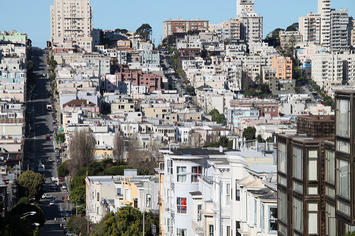
In expensive parts of the Northeast and the West Coast, the favored solution to the housing affordability crisis is to pack more people into a smaller space: force households into smaller homes and apartments by raising the price of single-family dwellings for middle-income buyers through land-use restrictions.
This approach may produce some units, but it hardly addresses the affordability issue. By most measures, higher-density housing is far more expensive to build. Gerard Mildner of the Center for Real Estate at Portland State University, notes that a high rise over five stories costs nearly three times as much per square foot as a garden apartment. Even higher construction costs are reported in the San Francisco Bay Area, where townhome developments can cost up to double that of detached houses per square foot to build (excluding land costs), and units in high rise condominium buildings can cost up to 7.5 times as much.
New York epitomizes the limitations of density to address the affordability crisis. The Big Apple ranks third behind Houston and Dallas-Ft. Worth in total residential construction permits from 2011-14 at 140,041 units, but that’s underwhelming given that it’s the most populous metro area in the nation by far. That total represents only 2.0% of the metro area’s 2010 housing base, 42nd best out of the nation’s 53 largest MSAs.
Nearly 75% of the New York area’s housing construction over that span was multifamily, with permits for 103,000 units from 2011-14, but that only makes for a 2.6% increase in apartment supply over 2010, placing it a meager 39th among the major metro areas over that span.
That 75% multifamily proportion is common in other expensive, highly regulated markets such as Los Angeles and San Francisco. In Boston, regulatory and land costs have boosted the cost of building a 1,600 square foot apartment to $438,000.
The failure of high-density housing to relieve the affordability crisis is most evident in the Golden State. The state’s largest metro areas have among the highest ratios of home prices to income. Prices in San Diego, Los Angeles have all risen considerably above the national average, despite only meager economic recoveries. San Jose and San Francisco have also experienced huge home price increases and are among the most unaffordable major metropolitan markets in the nation. Among these, only San Jose ranks in the top 10 in multi-family building permits as a percentage of the 2010 base (fifth).
The Metro Areas That Are Lagging, And What Lies Ahead
The lowest rung of our rankings are mostly smaller, old industrial cities with little in the way of population growth. Providence, R.I., barely eked out 1% growth in its housing supply since 2011. Other low-ranking areas include Hartford, Cleveland, Detroit, Milwaukee, Chicago and Rochester.
Overall, future prospects seem to be brighter in cities that have both reasonable prices and strong economies. These metro areas, which dominate our list, have the advantage also of being able to offer millennials, as they age, the sort of affordable single-family housing that they tend to move into during their 30s and beyond, notes economist Jed Kolko.
By building both single-family and multifamily housing at a higher clip, these areas are building the foundations for future growth, particularly for the next generation. There will be ups and down in the years ahead, but metropolitan areas producing adequate, diverse and affordable housing seem likely to enjoy future advantages in the race for talent and jobs.
Full List: The Cities Building The Most New Housing
This article was originally published by Forbes on 12/17/2015
