Housing Affordability and the Standard of Living: The 14th Annual Demographia International Housing Affordability Survey
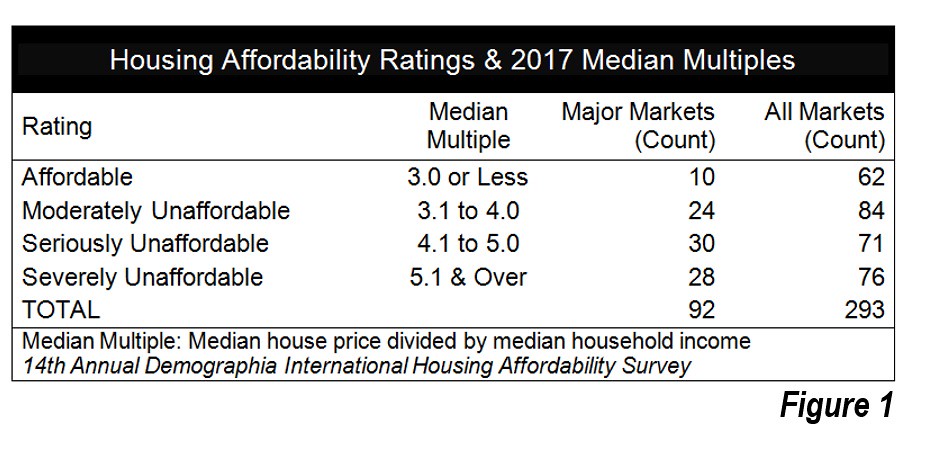
For the eighth year in a row, the Demographia International Housing Affordability Survey shows Hong Kong to be the least affordable housing market (metropolitan area) in nine nations. Hong Kong’s Median Multiple is 19.4, up from 18.1 last year. The Median Multiple is price to income ratio used in the Survey, calculated by dividing the median house price by the median household income. The Demographia middle-income housing affordability ratings, as well as the summarized results, are shown in Figure 1. The Survey includes 293 markets in nine nations.
The Very Large Markets:
Hong Kong is among 17 very large markets, with more than 5,000,000 population (Figure 2), included in the Survey. Eight of the very large markets have severely unaffordable housing, with Median Multiples of 5.1 or more. In addition to Hong Kong, the very large severely unaffordable markets are Sydney (12.9), Los Angeles (9.4), London (8.5), Toronto (7.9), the London Exurbs (6.9), Miami (6.5) and New York (5.7), a metropolitan area that is divided between New York, New Jersey and Pennsylvania. The best housing affordability among the very large markets is in Atlanta (3.2), Osaka-Kobe-Kyoto and Philadelphia (3.5), Houston (3.7) as well as Chicago and Dallas Fort Worth (3.8).

The Major Markets
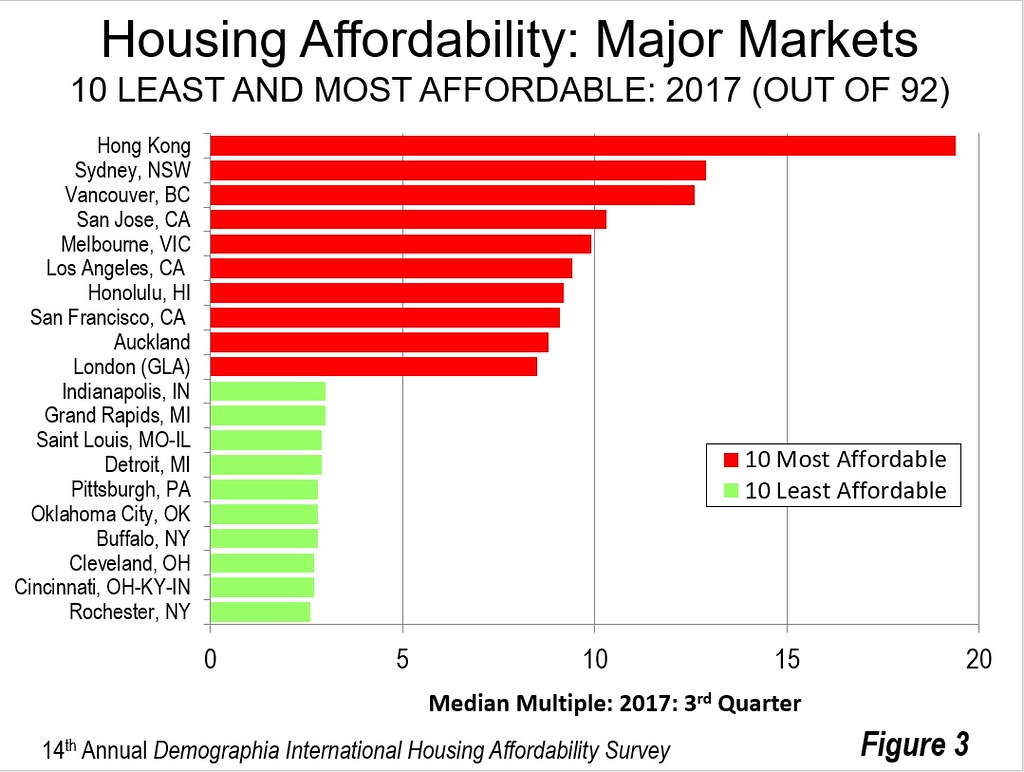
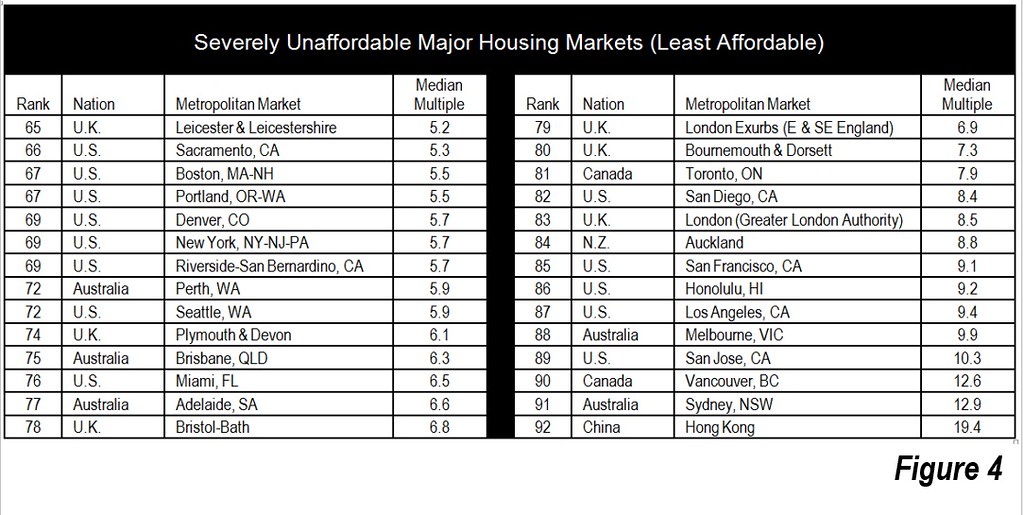
There are 92 major markets: metropolitan areas with more than 1,000,000 population. In addition to the very large markets noted above, the least affordable 10 includes Vancouver, which at 12.6 the third least affordable market, followed by San Jose (10.3), and Melbourne (9.9). There are 28 severely unaffordable markets, which are shown in Figure 4. These include all major markets in Australia (5) and New Zealand (1). Two of Canada’s six major metropolitan areas — Toronto and Vancouver —are severely unaffordable and six of the United Kingdom’s 21 major markets, including London and the London exurbs. The largest number of severely unaffordable markets is in the United States, at 13. This represents, however, less than one-quarter of its 54 markets.
The least expensive major market is Rochester, New York (2.6), for the second straight year. Cincinnati (OH-KY-IN), Cleveland, Buffalo, Oklahoma City, Pittsburgh, Detroit, St. Louis, Grand Rapids and Indianapolis are also among the most affordable, all having Median Multiples of 3.0 or less. All 10 affordable major markets in the Survey are in the United States.
All Markets
Among the 293 markets in the Survey, 76 are severely unaffordable markets, with 30 in the United States (out of 175), 15 in Australia (out of 22), 14 in Canada (out of 46), 10 in the United Kingdom (out of 33) and six in New Zealand (out of eight). There are no severely unaffordable markets in Ireland or Singapore.
There are also 62 affordable markets (Median Multiple of 3.0 and less — 49 in the United States, 11 in Canada and two in Ireland.
The Spread of Unaffordable Markets
The number of severely unaffordable housing is growing, particularly in markets close to ultra-expensive areas like Vancouver, Toronto, San Francisco and San Jose in the Bay Area. Victoria, Kelowna and Nanaimo have followed nearby Vancouver into severe unaffordability. Hamilton, Kitchener-Waterloo, Oshawa, St. Catharines-Niagara, Guelph, Barrie and Cambridge have followed Toronto. In recent years, Sacramento, Fresno, Merced and Modesto in California’s Central Valley — despite their severe economic troubles — have become severely unaffordable, as some leave the San Francisco Bay Area to find cheaper housing. California continues to be in a serious housing crisis, with its major market Median Multiple having risen more than 7.5 times that of liberally regulated US markets.
Introduction by 3 Top Housing Economists (from the London School of Economics)
Three of the world’s leading housing market analysts, economists Felipe Carozzi, Paul Cheshire and Christian Hilber of the London School of Economics (LSE) have provided the Introduction to this year’s Survey.
Consistent with their substantial international work, they note that the need for “good measures” of housing affordability. Moreover, their contribution is especially appropriate coming from Britain, which they characterize as “the cradle of housing unaffordability and the originator of the ideas and mechanisms of planning which have contributed so much to the problem: Green Belts and planning by unpredictable political processes!” From an examination of the British markets last year’s Demographia results and their own analysis, they conclude that “that housing is most unaffordable for the lower income groups even though they buy cheaper houses.”
Housing Affordability and the Standard of Living
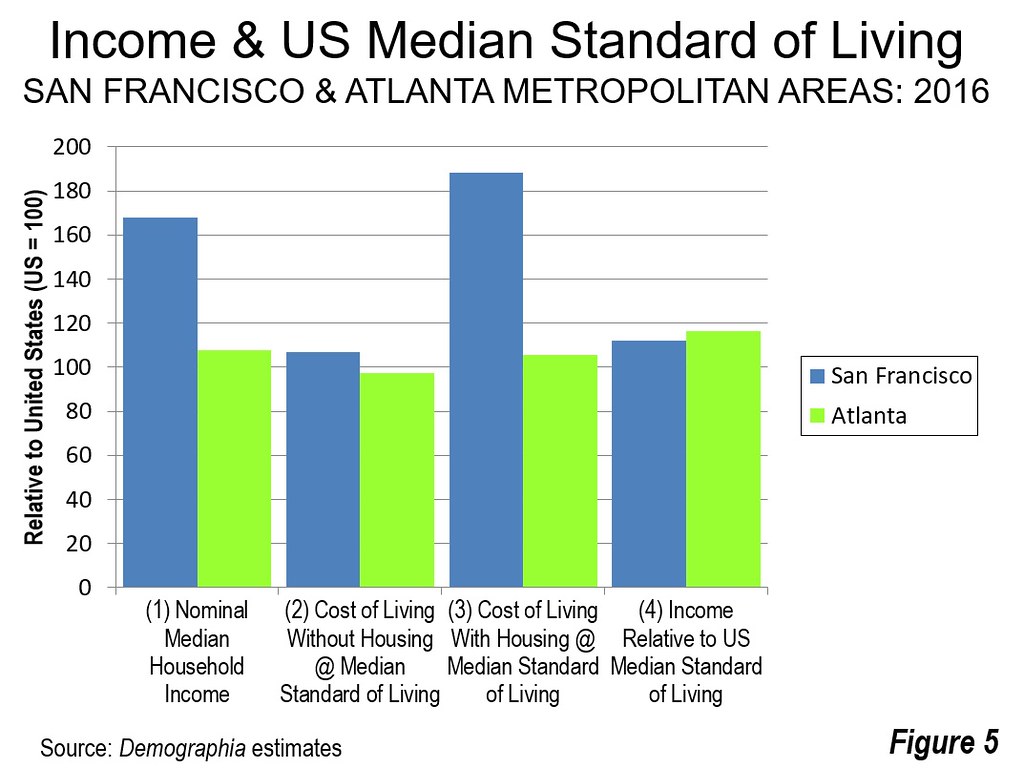
This year’s policy focus is impact of severely unaffordable housing increases the cost of living. Far more than any other household budget item, higher costs in housing can boost the cost of living and lead to greater levels of poverty. As housing costs increase relative to household incomes, severely unaffordable housing — also related to increases in rents — retards the standard of living. For example, in the United States, among the 107 metropolitan areas with more than 500,000 population, there is a 0.83 correlation between higher costs of living and more severe housing affordability (higher Median Multiples) for new household movers to housing markets. This is a very high correlation, with perfect correction being 1.00 and negative correlation being minus 1.00.
For example, in the San Francisco metropolitan area, housing costs more than cancel out the more than 50 percent household income advantage it enjoys over the Atlanta metropolitan area (Figure 5).
The Housing Affordability Crisis: A Standard of Living Crisis
The housing affordability crisis translates ultimately into a standard of living crisis. It results from demand that continues to exceed supply. Virtually all of the severely unaffordable markets have urban containment policy or the equivalent. Urban containment severely limits or even prohibits building the low-cost housing tracts that have contributed so much to rising home ownership rates and greater affluence since World War II.
If supply is not materially liberalized, worsened housing affordability is likely. Former Governor of the Reserve Bank New Zealand Donald Brash indicated: “…the affordability of housing is overwhelmingly a function of just one thing, the extent to which governments place artificial restrictions on the supply of residential land.”
Policy Responses
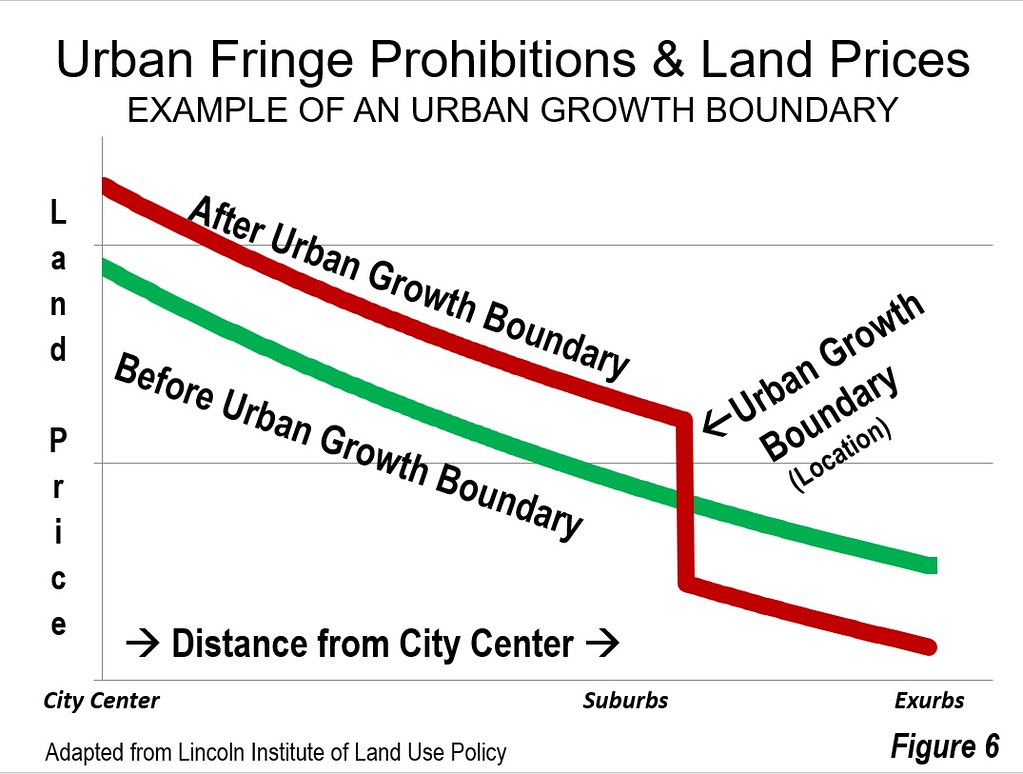
There is an emerging understanding that more new housing supply is required to address housing affordability. However, in urban containment metropolitan areas, interest in new supply has been largely limited to higher density infill, while leaving the urban periphery restrictions in place. This seriously diminishes the potential for improving housing affordability, because the lowest land prices tend to be on the urban periphery (Figure 6). For example, Ryerson University research indicates a need to increase the supply of new ground-oriented housing (detached, semi-detached and townhouses) to improve Toronto’s deteriorated housing affordability, which is fundamentally a land cost problem (as it is in other severely unaffordable markets). Unless urban fringe restrictions are relaxed enough to restore the competitive market for land, housing affordability is unlikely to improve and could continue to worsen.
At least one government seems determined to tackle severely unaffordable housing. The new Labour government of New Zealand takes office with a mandate to squarely address both housing supply and infrastructure finance for new development. We should all hope them success.
14th Annual Demographia International Housing Affordability Survey
