The House Prices are Too Damned High
 In recent years, the plight of renters in a stagnant economy has been covered extensively. A book title incorporated the phrase “the rent is too damn high” (by Matthew Iglesias). The “Rent is Too Damn High Party” ran candidates in both city and state of New York elections. However, as bad as rent increases have been, more serious has been the escalation of house prices in the major metropolitan areas of the United States. Choosing a new place can be stressful especially when you aren’t sure where to start your search, using somewhere like https://www.landmark24.com might be able to help with your search.
The Expected Nexus
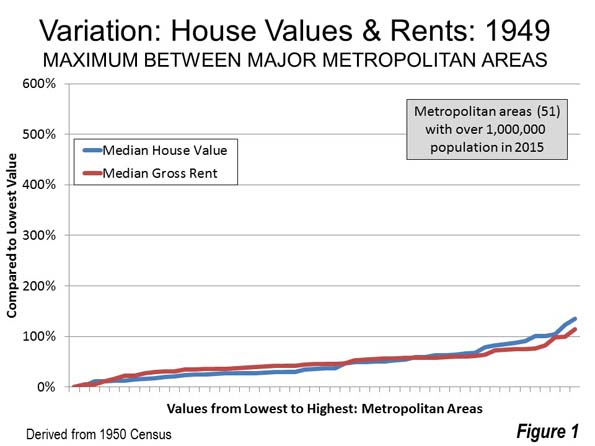
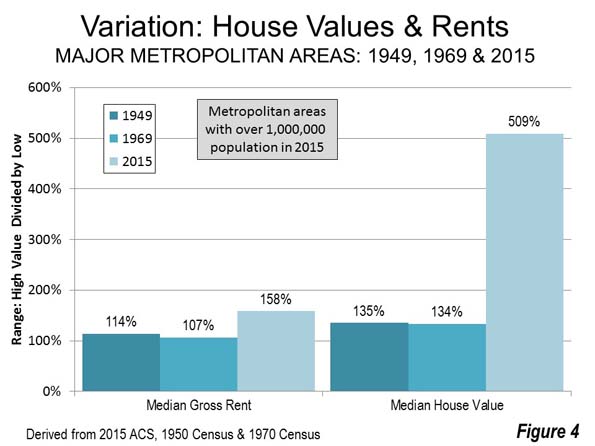
Generally, a closely aligned relationship between trends in owner occupied and rented housing costs would be expected . This was certainly true until 1970 (Note 1). In 1949 there was a 135 percent difference between the lowest median household value and the highest in the major metropolitan areas (Note 2). There was a similar 114 percent difference between the lowest gross rent and the highest (Figure 1). The house value variation was 18 percent higher than the rent variation.
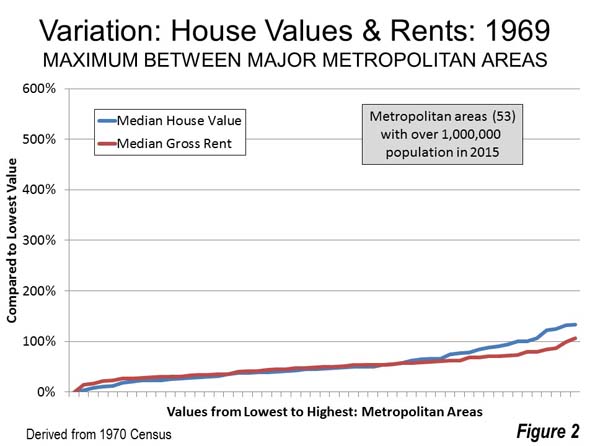
By 1969 median house values varied a maximum of 134 percent from the lowest figure to the highest, a slight reduction from the 135 percent difference across the United States in 1949. Median gross rents varied a maximum of 107 percent among the same metropolitan areas, down modestly from 1949’s 114 percent (Figure 2). The house value variation was 25 percent higher than the rent variation. The rising prices of houses are making it more enticing for people to look to renovate with the resources provided to them. This includes opting for new stair parts from somewhere like Pear Stairs rather than purchasing a new state of the art home.
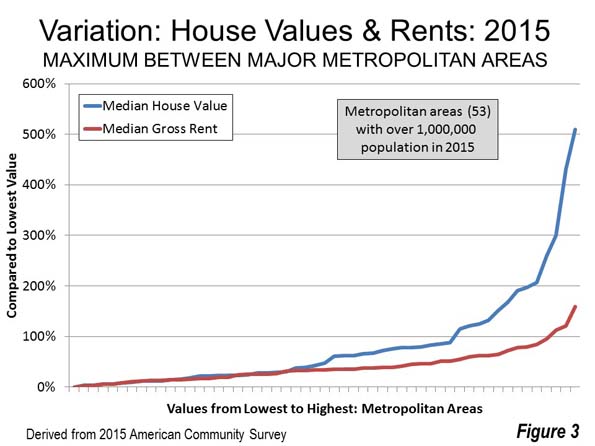
The close relationship between the variations in house value and rent was substantially broken in more recent decades. The 2015 American Community Survey shows that the variation among the major metropolitan areas in median house values is now a staggering 509 percent. The range between the least expensive and most expensive rental markets is a much smaller 158 percent (Figure 3). The difference in the variations between house value and rents across the nation rose to 222 percent, nearly nine times the 1969 figure.
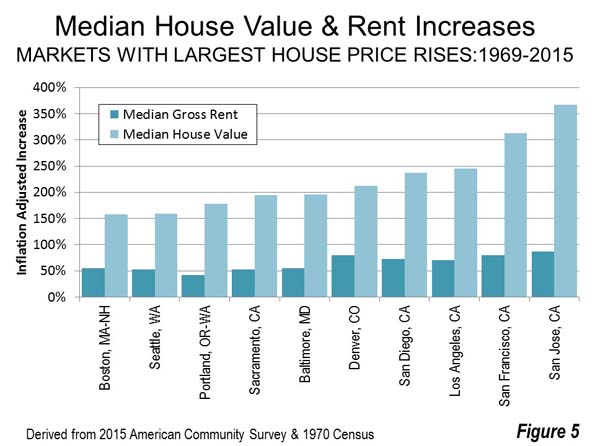
Among the 10 metropolitan areas with the largest house price increases between 1969 and 2015, house values increases averaged 226 percent, nearly 350 percent more than the 65 increase in median rents, both figures inflation adjusted (Figure 4).
Of course, the hideously expensive California metropolitan areas are well represented, such as San Jose, San Francisco, Los Angeles and San Diego, among the most impacted. Even inland Sacramento, with significant housing affordability problems often over-shadowed by the Bay Area, is included. However, the huge differences extend to metropolitan areas outside California, such as Denver, Baltimore, Portland, Seattle and Boston.
The broken relationship between rent and house value could imply severe distortion in either the rental market or the owned housing market.
If the Rent is Too Damn Low
Distortions in the market could have prevented rents to retain their relationship with rising house values.
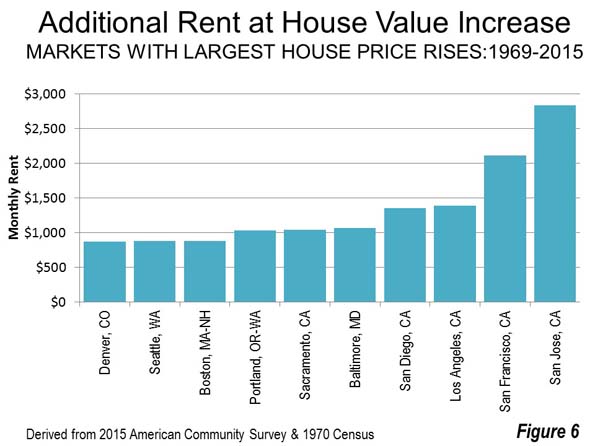
The implications are ominous. If the increase in rents had kept up with the increase in house values, the median gross rent in the San Francisco metropolitan area would have been approximately $3,700 per month, compared to the actual $1,600 per month in 2015. This would suggest that rents in 2015 were $2,100 below market in San Francisco. If this is true, then the rent is too damn low in San Francisco. The situation would be even worse down the road in San Jose where to keep up with house prices rents need to be $4,700 per month, $2,800 per month higher than market.
If the rental market is distorted, then rents are far too low in other metropolitan areas. In Los Angeles, San Diego, Baltimore, Sacramento and Portland rents are between $1,000 and $1,400 too low. Rents would be at least $800 below market in Boston, Seattle and Denver (Figure 5).
If House Prices are Too Damn High
If the owned housing market became distorted relative to the rental market between 1969 and 2015, then it is the rents that are too damn high. If house values had risen at the same rate as rents, none of the 53 markets would have exceeded a price to income ratio of 5.0, which denotes is denoted as “severely unaffordable” in the Demographia International Housing Affordability Survey. This would be a substantial improvement, given that 11 major markets actually were severely unaffordable in 2015.
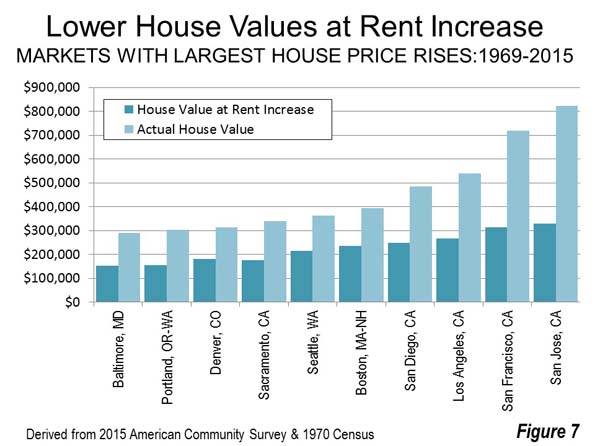
The 10 major metropolitan areas with the largest house value increases would have had hugely lower house prices. In San Jose, the median house value would have been equal to 3.2 years of median household income in 2015. This is considerably better than the actual 8.1 years, representing a 55 percent improvement. In San Francisco the median house value would have been equal to 3.5 years of median household income. This would be a 60 percent improvement on the actual 8.1 ratio in 2015 (Note 3).
In Los Angeles, Portland, Sacramento and San Diego, house values would have been about 50 percent less if they had risen at the same rate as rents. In Boston, Denver and Seattle, house prices would have been between 40 percent and 45 percent less (Figure 6).
It’s the House Prices that are Too Damned High
Rents have risen faster than incomes, but nothing compared to the increase in house prices. Clearly, house prices are too damn high. The huge increase between 1969 and 2015 in house prices is an anomaly that has become extreme in recent decades. The ranges in rents (1949, 1969 and 2015) and the ranges in house values in 1949 and 1969 were far more similar and reflected a reality more in line with the stability that would be expected in non-distorted markets (Figure 7). Indeed, the large increase in the 1969-2015 rent range could well have been influenced upward by the virulent house price increase (reflected in land prices).
It seems likely that rents across the country are much more reflective of an efficiently operating market, while there are serious distortions in the owned housing market. This why many people trying to create a new, affordable property create out of town buildings with companies like Raphael Homes as this is the easiest way to pay for properties. If you are looking to live in a city, you may have to find another way to afford housing!
Finally, owner-occupied housing, especially detached housing, has been under assault by restrictive urban planning regulations since 1970. House prices are most out of alignment in markets where this has occurred, especially in California, Oregon, Washington, and the Denver, Baltimore and Washington, DC metropolitan areas. More often than not, these regulations have evolved into urban containment policy (Note 4), which draws arbitrary lines around cities beyond which detached housing tracts are not permitted (See: Urban Containment, Endangered Working Families and Beleaguered Minorities). Obviously, as in goods and services generally, this regulatory over-reach makes housing less affordable (See: People Rather than Places, Ends Rather than Means: LSE Economists on Urban Containment).
There has been no such assault on multi-family building, which represents the bulk of rentals. This is not to suggest that rental regulation is perfect, only that the market distortions have been far more severe in reference to the owned housing market in some metropolitan areas, such as those identified above.
All of this has serious consequences for the nation and its threatened middle income households. With median household incomes below nearly two decades ago (perhaps for the first time in US history), economic stagnation and younger people burdened by rising college debt, lower house prices are a necessity in the over-regulated metropolitan areas. Yet there seems little desire on the part of most governments, particularly in the most severely impacted markets, to do much about it.
Note 1: These censuses collected house value and rent data for the previous year, 1949 and 1969 respectively. The rent and house value data referenced in this article was first available in the 1950 census.
Note 2: The 53 metropolitan areas with more than 1,000,000 population in 2015 (in 1950, only 51 of these had achieved metropolitan area status). The rent ranges cited in this article are calculated by dividing the highest major metropolitan area rent by the lowest major metropolitan area rent in the particular year. The house value ranges cited in this article are calculated by dividing the highest major metropolitan area house value by the lowest major metropolitan area house value in the particular year.
Note 3: Some analysts cite topographic barriers for creating the scarcity of land that has driven house price up so much in the San Francisco Bay Area (which includes both the San Francisco and San Jose metropolitan areas). As indicated in a previous article, there is far more land available for greenfield residential development in the Bay Area than would be required by even the strongest population growth.
Note 4: With respect to urban containment policy, Boston is an exception, which is the only seriously unaffordable major metropolitan area in the Demographia International Housing Affordability Survey that does not have urban containment policy. Boston has large lot zoning so expansive that it has created a severe shortage of land for development, with urban containment-like effects on house prices. Boston’s urbanization covers more land area than all urban areas in the world except New York and Tokyo, despite having only a fraction of their populations (See: The Evolving Urban Form: Sprawling Boston).
Photo: Sacramento: An inland California unaffordable housing market (by author)
Wendell Cox is principal of Demographia, an international public policy and demographics firm. He is a Senior Fellow of the Center for Opportunity Urbanism (US), Senior Fellow for Housing Affordability and Municipal Policy for the Frontier Centre for Public Policy (Canada), and a member of the Board of Advisors of the Center for Demographics and Policy at Chapman University (California). He is co-author of the “Demographia International Housing Affordability Survey” and author of “Demographia World Urban Areas” and “War on the Dream: How Anti-Sprawl Policy Threatens the Quality of Life.” He was appointed to three terms on the Los Angeles County Transportation Commission, where he served with the leading city and county leadership as the only non-elected member. He served as a visiting professor at the Conservatoire National des Arts et Metiers, a national university in Paris.
This article was originally published by New Geography on 10/21/16


