Coronavirus, Labor and an Aging World
In the last few months, we have gradually realized the dire nature of this global pandemic, and our response has been? Nothing short of the creation of a new world: hopefully not on the ruins of the last. The novel coronavirus is showing us the downside of accelerated mobility, excessive attention to short-term gains, and structural inequities in the micro and macro geographies of our planetary existence.
In the process of building the 20th century world, we focused on modern efficiency, productivity, and the creation of an ordered existence from which many common diseases could be banished. We came through national wars and wars on diseases feeling victorious and entitled. We even declared a war on poverty, but from that front we have not returned victorious. Instead, the prosperity of the post WW II era created an unquenchable thirst for consumption and the amassing of wealth. The question? Identities? of those left behind during this financial ascendance became a perennial topic for progressives and a rhetorical tool during election cycles. Non-profits and advocacy groups could at best engage in isolated skirmishes, a far cry from what might be expected from a large scale “war on poverty.”
Meanwhile, if a product could be made more cheaply in another place, we laid off labor and relocated jobs. Capital became mobile, while labor remained geographically bounded. In the age of fragmented capitalism, most of us quietly and indirectly condoned this behavior. We sought out cheaper and cheaper household items and shopped without a care for why sticker prices were so low. Who amongst us wouldn’t want a large screen TV for less than $300? We enjoyed summer fruits in winter, not considering that they were shipped from another hemisphere, and lost track of where our everyday food products were produced. “Made in…” was a tag that failed to grab our attention, and we failed to appreciate the global flow of products. During this period of sheltering in place, take the time and go around your homes and note where everything was made. Hopefully, the next time someone decides to scorn globalization, they will remember the global labor that has made our comfortable lives possible, and which should be of concern to all of us during this pandemic. Without inexpensive and unfortunately invisible labor, our quality of life would be significantly different.
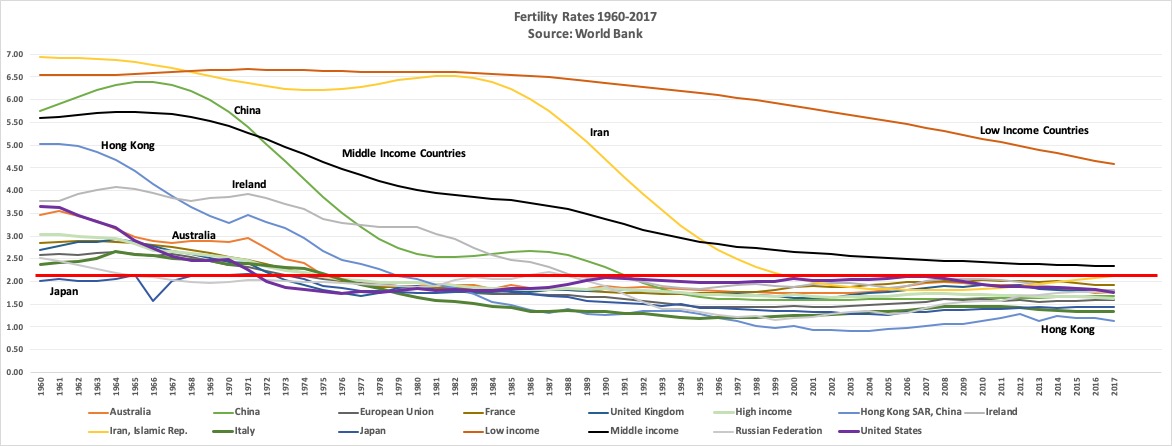
One of many lessons learned from this pandemic is that globally, we are not experiencing it equally, in part because of the differential graying of the global population. In the last three decades of the 20th century and the first decade of the 21st, fertility rates dropped in country after country (see Chart 1) quietly, but effectively. For the U.S., fertility rates hovered for a while close to a population replacement level of 2.1, but that too dropped after the 2008 recession. If that earlier recession is any indication, the post-COVID-19 era may also see fewer children, particularly in well-to-do, consumption-dependent countries.

As fertility rates dropped to levels not seen before, major cities with a high cost of living became home to smaller proportions of children. From New York to Tehran, Shanghai to Singapore, and Tokyo to Seoul and Stockholm, children began gradually vanishing. We could have noticed when some major city centers became void of children, but most of us didn’t. Instead, we turned our cities into playgrounds for adults as the world gradually grayed. In 1950, the median age of the world population1 was 23.6. In 2015, it reached 29.6, and, at this rate, it will exceed 36 by 2050. The aging pattern in advanced economies is significantly different. With a fertility rate of 1.3, median age in Italy increased from 28.6 in 1950 to an estimated 47.3 in 2020. By 2050, Italy’s median age will approach 54. This means more than half of the population will be retired or close to it. China is in a similar boat: its median age increased from 23.9 in 1950 to an estimated 38.4 in 2020. The United States, with its baby boom era and large immigration, remained slightly younger, with a 1950 median age of 30.2 and a relatively young population until 1970. By 2010, however, our median age reached 36.9 and our current estimated median age is 38.3. We are expected to achieve a median age of 42.2 by 2050, if all remains the same. If we do decide to prevent the flow of global labor migrants, we might follow the example of other countries and gray even more rapidly. Some say demography is destiny, but we should also note that labor and urban policies shape that destiny.
What will this aging mean in a post-COVID-19 world? While the polio pandemic of the 20th century taught us how a young population could suffer, the novel coronavirus is teaching us what pandemics mean for an aging world. Even though we have grayed, we failed to prepare our social and healthcare infrastructure for a geriatric world. We could have done better than privatizing elderly care.
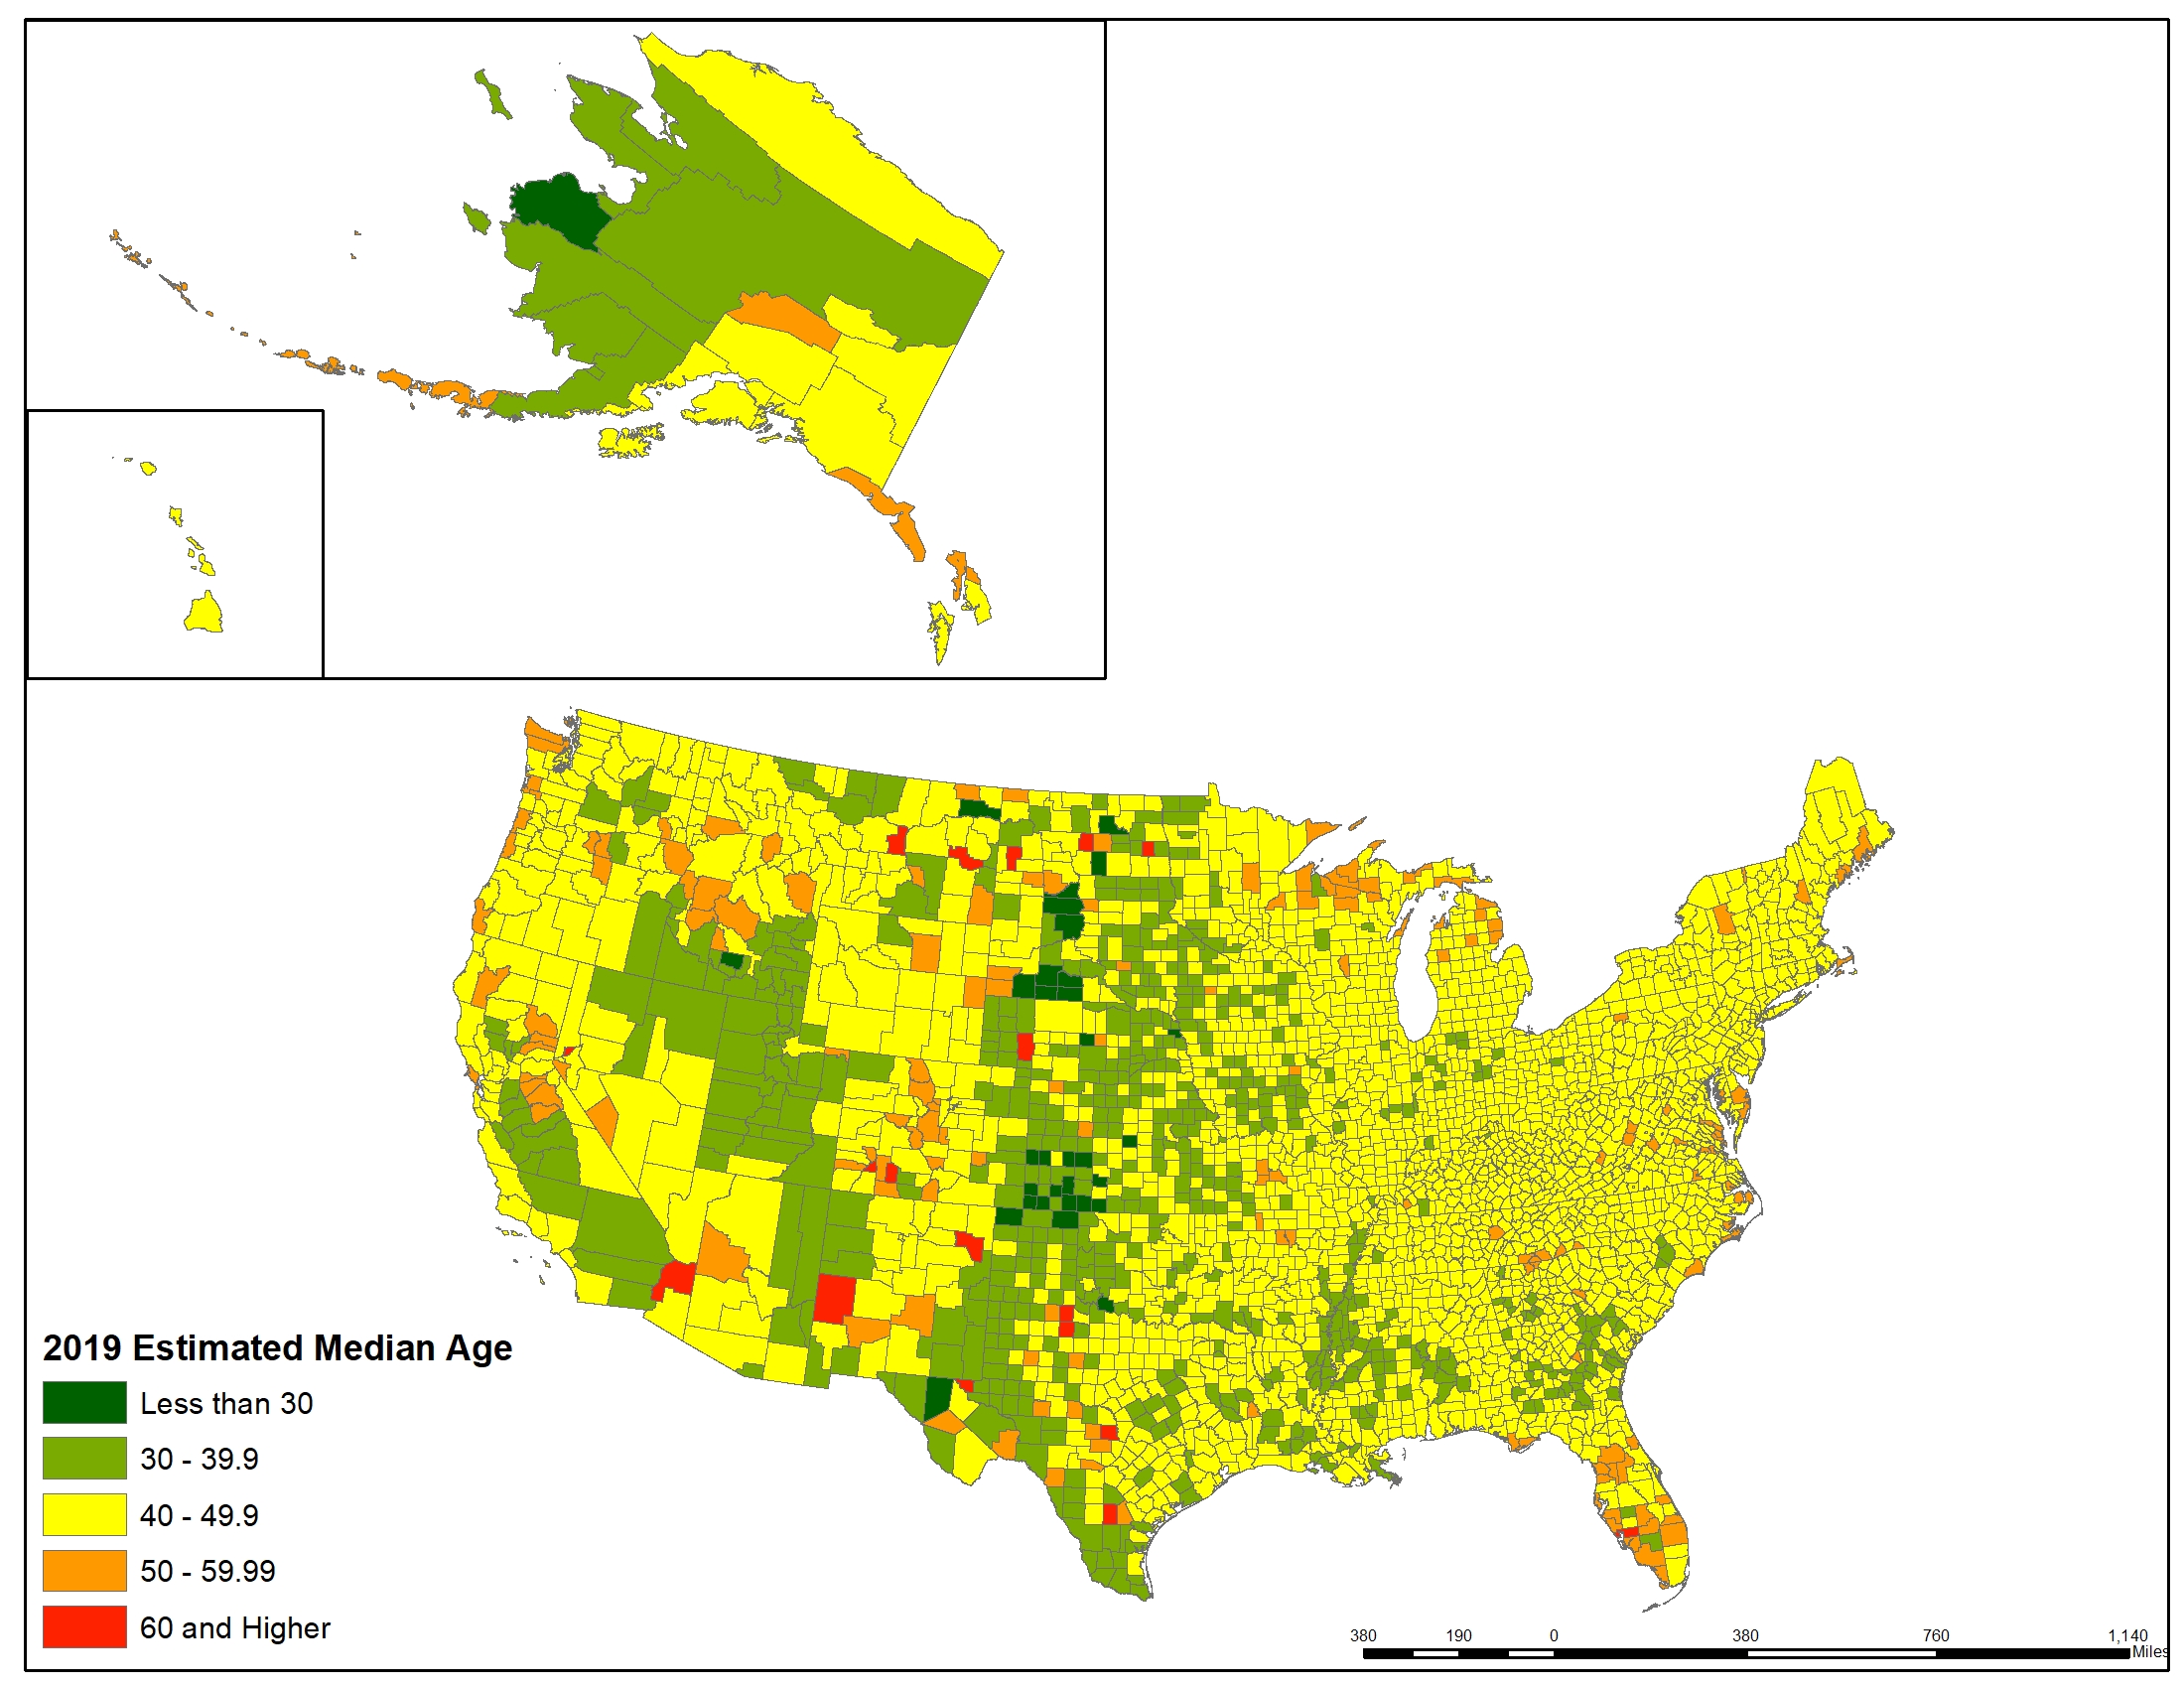
As is the case with everything else, there is a spatial inequity in aging and healthcare support. The aging pattern in the U.S. is not geographically even, and a map showing median age by county serves as a reminder of our emerging vulnerability to the novel coronavirus (see Map 1). Connecticut, Maine, Massachusetts, New Hampshire, and New Jersey were among the oldest states in 2019, with an estimated median age of 47.8 in 2019. However, looking at the county level data might be shocking to a nation that has forgotten what it means to live in rural areas. Sheridan County in North Dakota, and Harding County in New Mexico both had an estimated median age of 89.5. Granted, these counties are not highly populated: Sheridan County has a population of about 1,300. However, these are the very places where the novel coronavirus could wreak havoc if adequate healthcare services are not in place. While we have started to think about resiliency, we have not fully understood or appreciated what a graying world may mean to all of us.

Data: Geolytics. Mapping and Analysis by the Author.
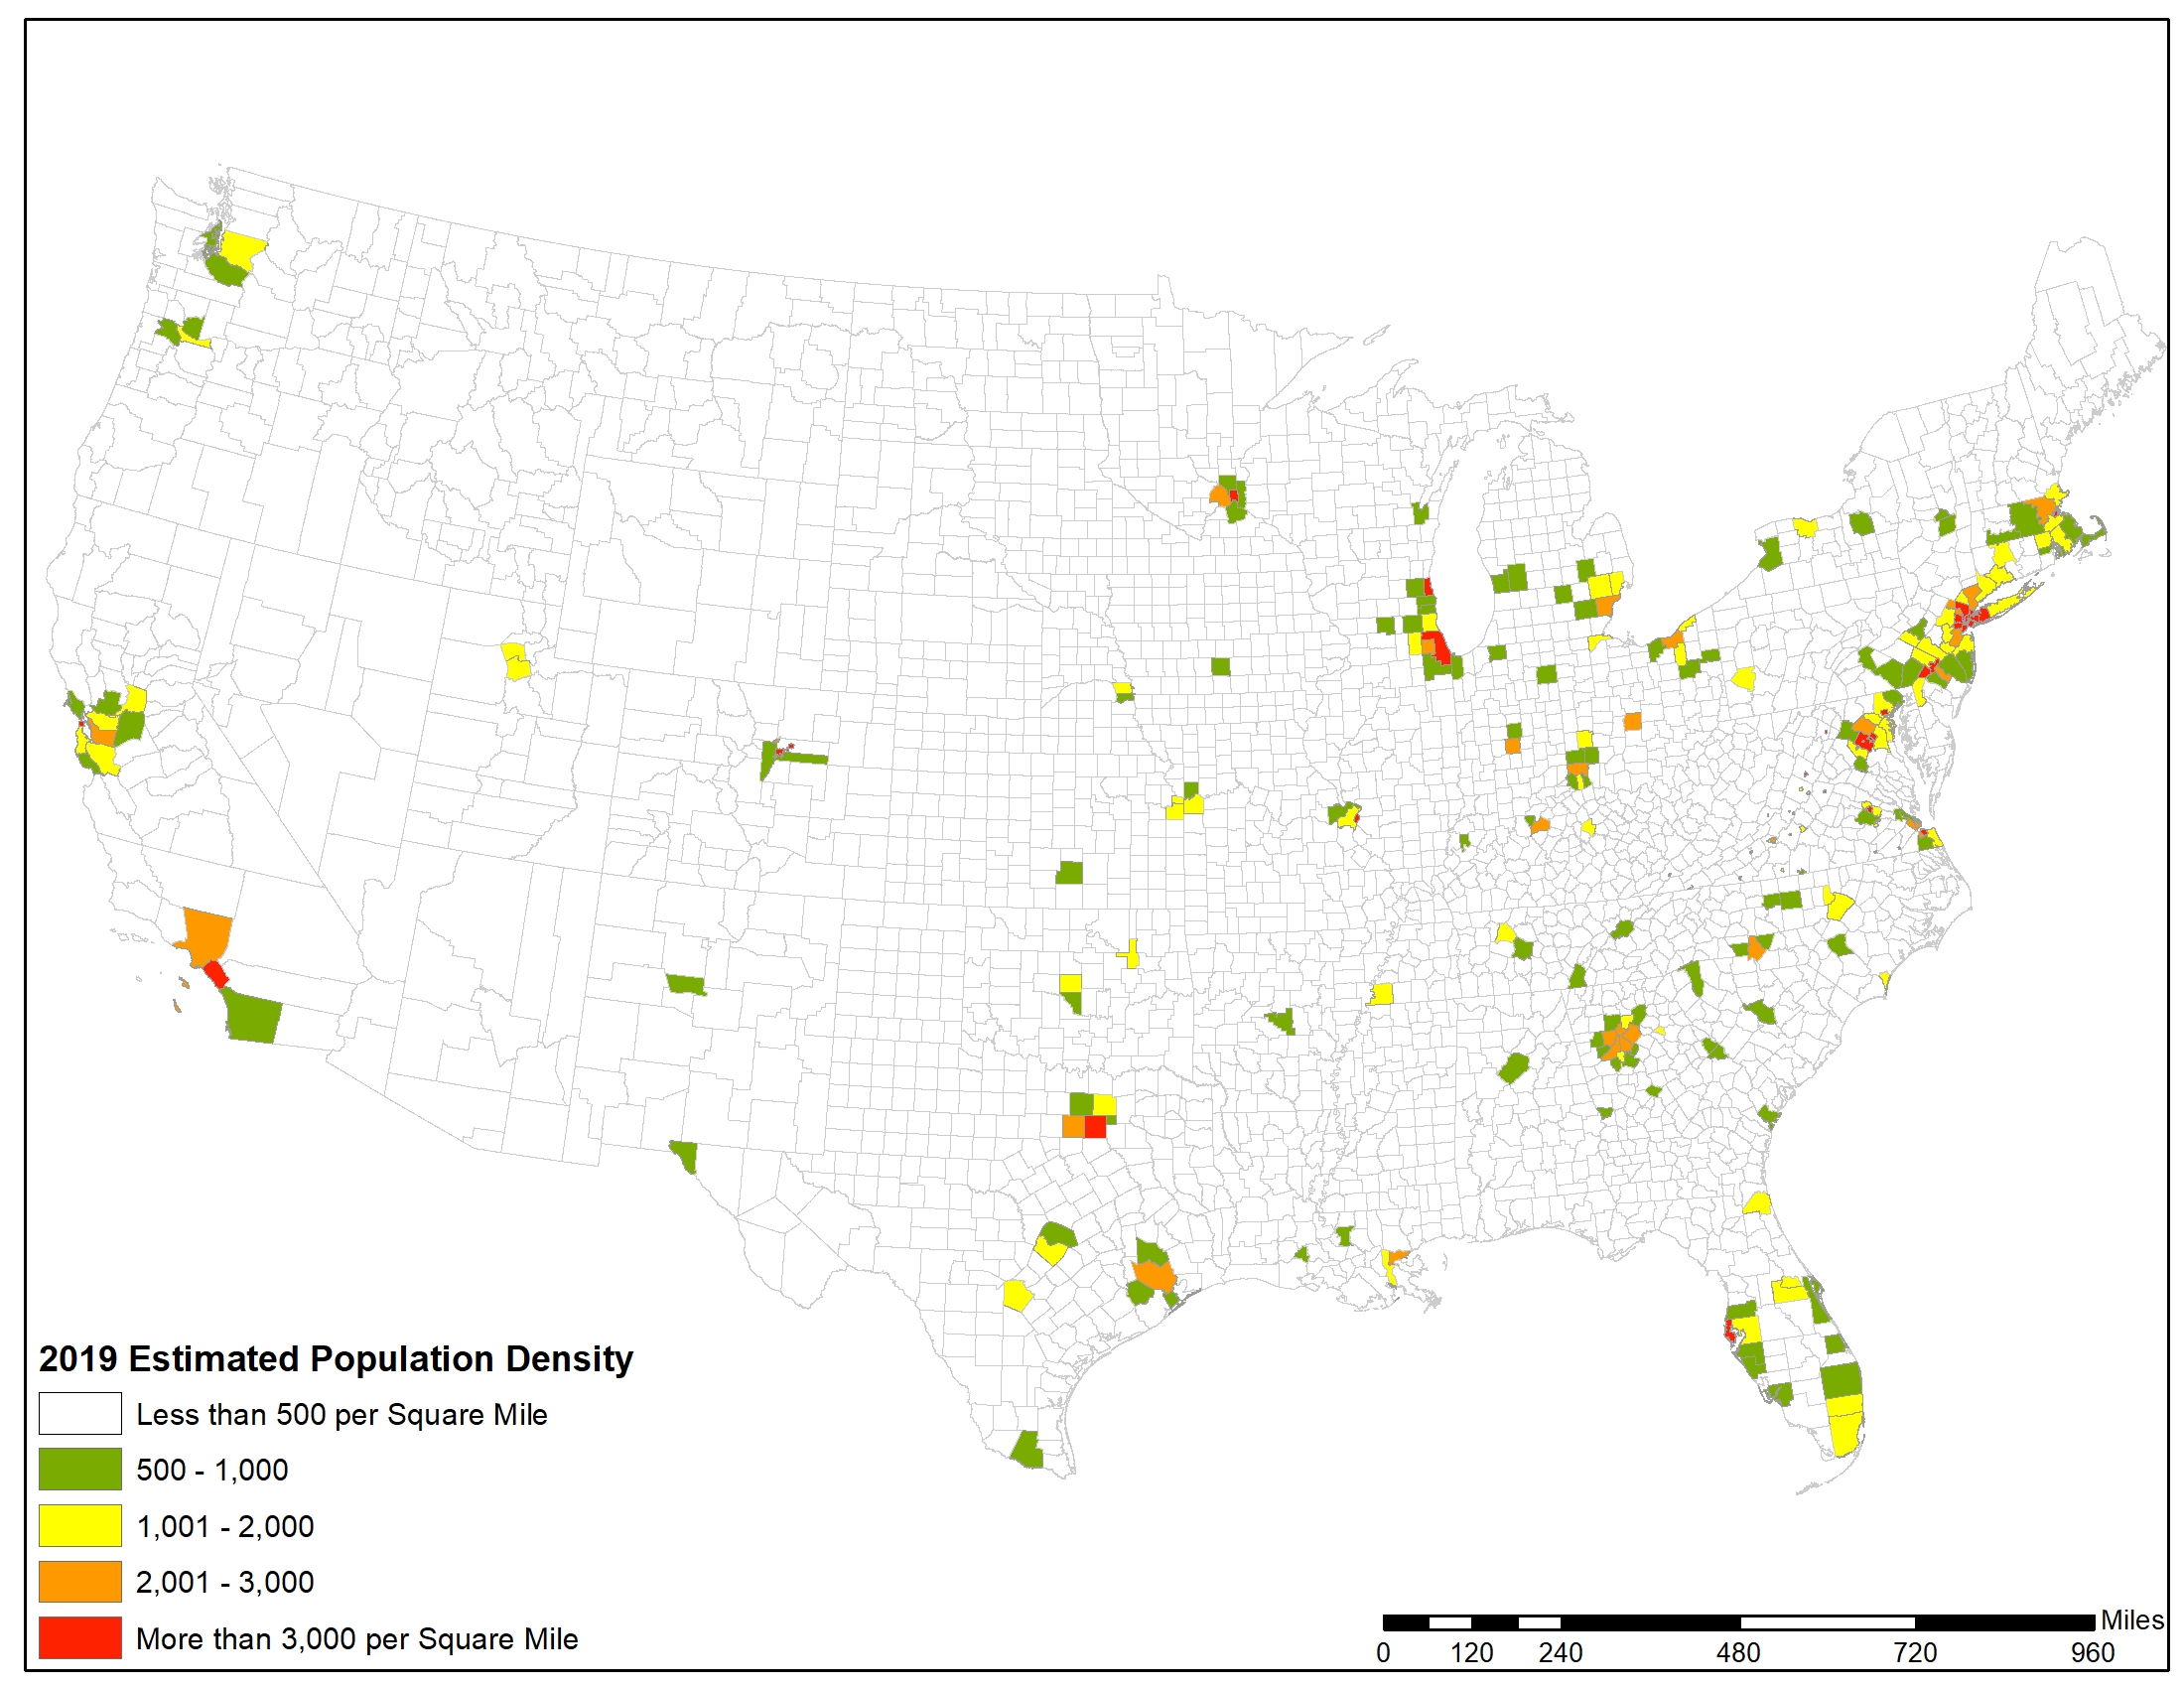
For now, as the county-level map shows, our hardest hit areas are those with the highest population densities. The elderly in these high-density regions are the most vulnerable to COVID-19, and if the virus reaches counties with significantly older populations, safe places for the elderly will shrink. It is time that we think about people locally, nationally, and globally with more empathy than greed and with more kindness than enmity. This is not the time to be indifferent to our ‘others.’ If one stage of grief is bargaining, let us promise that we will build a world in which cities and rural areas are age friendly. Let’s make sure people are housed, fed, and provided with healthcare services. Let us be more kind to labor, those left behind in the post-industrial world and those arriving at our doors to perform much-needed work. In a graying world, we need to better manage the flow of labor to make all of our lives better. We need to remember that given the current global patterns of aging, labor will continue to be supplied by low-income countries, particularly from Africa and Latin America. Hopefully, we will be more open to the mobility of labor and will understand the value of global labor migration.
Look at the map of the world and imagine yourself in it, as a neighbor and a friend.

Data: Geolytics. Mapping and Analysis by the Author.
Endnote:
1. https://population.un.org/wpp/DataQuery/
This piece first appeared at New Geography.
Ali Modarres is the Director of Urban Studies at University of Washington Tacoma. He is a geographer and landscape architect, specializing in urban planning and policy. He has written extensively about social geography, transportation planning, and urban development issues in American cities.
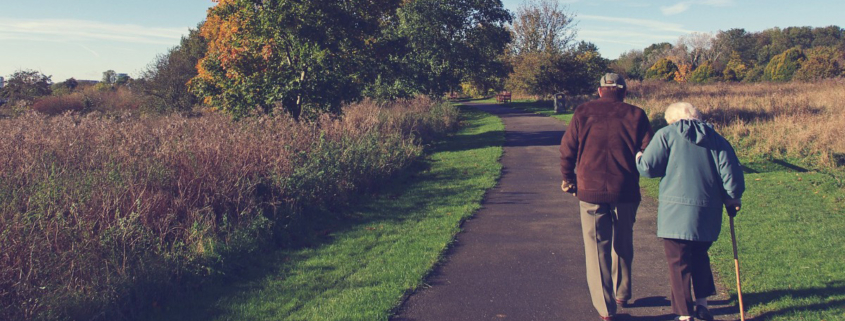
Photo credit: PXhere


