
Transport Costs & Subsidies by Mode
Supporters of increased subsidies to urban transit and intercity passenger trains often argue that all transportation is subsidized, so it’s only fair that transit and Amtrak should also be subsidized. While it’s true that most transportation is subsidized, it is worth looking at the extent of those subsidies to judge whether subsidies to some forms of transport should be increased or reduced.
Click image to download a four-page PDF of this policy brief.
Americans spent about $1.3 trillion of their personal incomes on transportation in 2017 (based on the Bureau of Economic Analysis’ National Income and Product Accounts (NIPA) table 2.5.5, lines 53 and 116). On top of this, transportation received about $200 billion in subsidies from federal, state, and local governments (based on subtracting total government expenditures on transport from total government revenues from transport).
In exchange for these costs and subsidies, Americans traveled more than 6.2 trillion passenger miles, or almost 20,000 miles per person, and shipped 5.1 trillion ton-miles of freight, or more than 15,000 ton-miles per person. Costs and subsidies can be broken down by mode with a high degree of precision for highways and transit, and slightly less precision for airlines and Amtrak. Since I am interested in passenger transport, I’m not going to attempt to calculate subsidies for water transport or pipelines.
Automobile Costs and Subsidies
According to the Bureau of Economic Analysis’ NIPA table 2.5.5, lines 54, 57, and 116, Americans spent $1.15 trillion buying, operating, maintaining, and insuring their motor vehicles in 2017. The Bureau of Transportation Statistics National Transportation Statistics table 1-40 says that light vehicles, including motorcycles, provided 4.84 trillion passenger miles of travel. That works out to an average personal expenditure of 23.8 cents per passenger mile on driving.
The Federal Highway Administration’s Highway Statistics annual report includes a table, HF-10, that gives total government expenditures and revenues from highways. While the Federal Highway Administration is late in posting HF-10 for 2017 (and has never posted it for 2013), the agency kindly sent me “draft” spreadsheets for the 2017 and (for those who want to dig back into history) 2013 tables.
Some people look at these tables and see that gas taxes and user fees spent on highways cover a certain percentage of total highway costs and presume that the rest is a subsidy. But that overlooks two points. First, billions of dollars of highway user fees are diverted to other purposes, mainly mass transit. It’s unfair not to count these fees which users pay just because they are embezzled by other modes. Second, some of the costs of highways are paid for out of interest earned on user fees and from the proceeds of bond sales that will eventually be repaid out of user fees. These cannot be considered subsidies.
My approach is to total the actual general funds that are spent on highways and subtract from those general funds the diversions of highway user fees to mass transit and other purposes. The result is the net subsidy to highways. Most of these numbers can be found in table HF-10.
The 2017 edition of the table says that the federal government spent $3.3 billion in general funds on highways, the states spent $17.6 billion, and local governments spent $47.2 billion. What the table doesn’t say but is found in table FE-210 is that, in 2016, Congress gave the Federal Highway Administration $50.9 billion. Congress used to spend no more on highways than it collected in highway user fees, but in 1998 it tossed this principle out the window in favor of more pork barrel. As a result, every few years it has had to transfer general funds to the highway fund, and the $50.9 billion was meant to cover overspending for the next five years. So I’m adding one-fifth of this money, or $10.2 billion, to the subsidy for 2017.
Offsetting these subsidies, table HF-10 shows that $6.5 billion in federal highway user fees were spent on mass transit, and another $1.3 billion were spent on such things as (according to table FE-10) the the Land & Water Conservation Fund and Sport Fish Restoration and Boating Fund. The states spent $11.9 billion of state gas taxes, vehicle registration fees, and tolls on mass transit and another $14.4 billion on education and other general purposes. Finally, local governments don’t collect many highway user fees, but of those they did collect, they spent about $0.9 billion on non-highway programs.
Note that the diversions of state user fees were almost 50 percent greater than the state general funds spent on roads. In fact, they offset all of the state and most of the federal general funds spent on roads. In other words, state highway pretty much pay for themselves, and most of the subsidies for roads come from local governments.
Some people argue that local property taxes spent on roads shouldn’t count as subsidies because property values are significantly increased by road access. I count them as subsidies, however, because there is no guarantee that such enhanced values are proportional to the taxes paid.
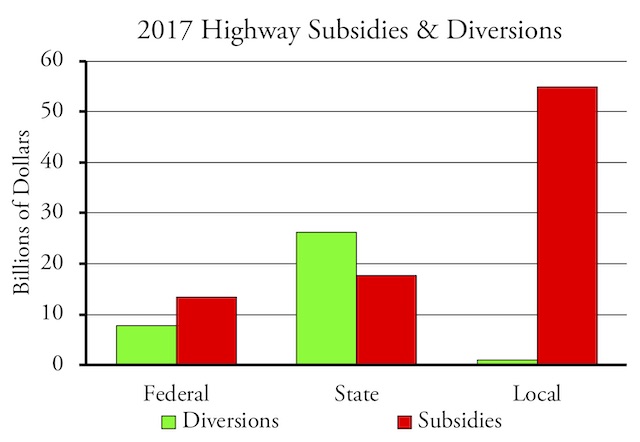
Even with Congress spending like a drunken sailor, most highway subsidies net of diversions of highway user fees are at the local level.
Counting federal, state, and local governments together, general funds spent on roads totaled to $86.1 billion in 2017. Offsetting this was $35.0 billion in diversions from highway user fees to other purposes, leaving a net subsidy of $51.1 billion.
Counting light vehicles, motorcycles, and buses, Americans traveled 5.2 trillion passenger miles on highways in 2017. I’m not counting another 0.3 trillion passenger miles carried by heavy trucks, since those “passengers” were truck operators, not people trying to get from one place to another. The $51.1 billion in subsidies divided by 5.2 trillion passenger miles represents a subsidy of just under a penny per passenger mile.
But wait — highways produced more than just passenger travel. According to table 1-50 of National Transportation Statistics, they also produced 2.0 trillion ton-miles of freight shipments. For the purpose of allocating highway subsidies to passengers and freight, I decided to use the value of passenger miles and freight ton-miles. We know passenger miles are worth 23.8 cents to users, while freight revenues per ton-mile are shown in National Transportation Statistics table 3-21.
Unfortunately, table 3-21 only has data through 2007, when shippers were spending an average of 16.54 cents per ton-mile. Between 1990 and 2007, shipping costs grew at 88 percent of the rate of inflation. Assuming that rate continued, I calculate that shipping cost 17.1 cents per ton-mile in 2017. That means 1.39 ton-miles is equal to 1 passenger mile, so highway subsidies average 0.8 cents a passenger mile and 0.6 cents a ton-mile.
In short, Americans personally spend about 23.8 cents per passenger mile on driving and receive subsidies of 0.8 cents a passenger mile, mostly from local governments. Incidentally, the $1.15 trillion Americans spend on driving is only 6.8 percent of personal incomes (found in table 2.1.1 of the NIPA data). Although the average American drives a lot more today than in 1985, the share of our incomes that we spend on driving has slowly declined from 9.8 percent in 1985 to 8.5 percent in 1995, 8.3 percent in 2005, and 6.9 percent in 2015.
Transit Costs and Subsidies
Transit costs and subsidies are easiest to calculate because all of the data are in National Transit Statistics. Various spreadsheets in this annual report show passenger miles, fares, operating costs, and capital costs. I’ve gathered all of these data into one spreadsheet that breaks these numbers down by transit agency and mode and then summarizes them by mode and urban area.
In 2017, Americans paid $15.8 billion in fares to travel 55.0 billion passenger miles by public transit, for an average fare of 28.8 cents per passenger mile. Transit agencies spent $66.4 billion providing those services, or $1.207 per passenger mile. The net subsidy was $50.5 billion or 91.9 cents per passenger mile. Since Americans travel more than a hundred times as many passenger miles on highways as by public transit and the subsidies to the two are both around $51 billion, the transit subsidy per passenger mile is more than 100 times the subsidy to driving. This doesn’t count transit’s share of highway subsidies, a share made larger by the fact that transit agencies are exempt from paying federal and (in most states) state fuel taxes.
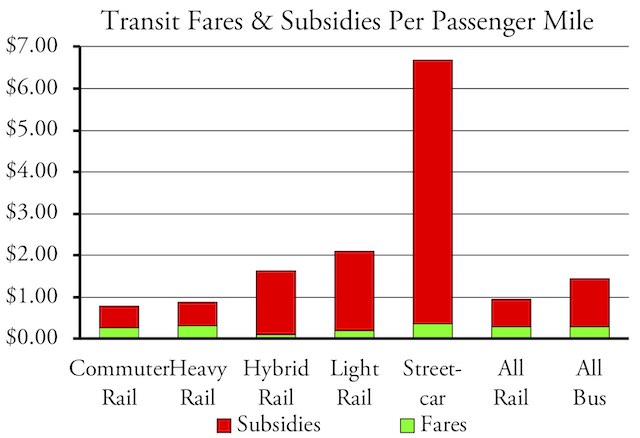
Subsidies cover the vast majority of the costs of public transit. Rail appears to cost a little less than bus because the high capital costs and deferred maintenance of legacy rail systems in New York, Chicago, Boston, Philadelphia, San Francisco, Atlanta, and certain other cities isn’t included in these calculations.
For what it’s worth, we can break down the costs and subsidies by major modes. This is a little bit unfair to light rail and streetcars because some of 2017’s capital expenditures are for infrastructure that will last for several decades. This is less of a problem for other rail modes that have most of their infrastructure already built; in fact, costs for those modes are underestimated because they don’t take deferred maintenance into account. The numbers for buses combine commuter, rapid, and trolley buses with regular buses. It is interesting to note that average rail fares are a penny lower, per mile, than bus fares, refuting the frequent claim that people prefer to ride trains over buses.
Airline Costs and Subsidies
National Transportation Statistics table 3-20 shows that airline fares in 2017 averaged 13.7 cents per passenger mile. The best indication of subsidies is from tables 3-32, government revenues, and 3-35, government expenditures by mode.
Unfortunately, the most recent year shown on this table is 2014, when government expenditures on air travel were $8.7 billion more than government revenues from air travelers (through airline ticket taxes and fees). A look at previous years show that government revenues have been increasing while expenditures have been declining; assuming those trends continued, the subsidies in 2017 were just $4.5 billion. However, to be cautious, I’m going to use $8.7 billion.
Table 1.40 shows that the commercial airlines carried a record 693 billion passenger miles in domestic travel in 2017. This doesn’t count private air travel, which was another 16 billion passenger miles in 2001, the last year that data are available. A lot of the subsidies are to private airplanes, as most of the subsidies go to smaller airports and private planes don’t pay as much to use airports as commercial planes.
Ignoring that, the $8.7 billion in subsidies, if that is what they were, average 1.25 cents per passenger mile. That means the total cost of air travel averages about 15 cents a passenger mile.
Amtrak Costs and Subsidies
Amtrak subsidies are the most difficult to calculate because Amtrak does its best to mystify the data. For example, National Transportation Statistics table 3-20 shows Amtrak fares average 39.2 cents per passenger mile in 2017. But Amtrak includes subsidies from the states in “passenger revenues,” and I suspect the compiler of National Transportation Statistics was deceived by that claim into counting those “revenues” as fares.
Amtrak’s performance report for the end of its 2017 fiscal year shows that it collected $2.2 billion in ticket revenues and $0.1 billion in food and beverage revenues. Based on this, I would count total passenger revenues of $2.2 billion. The report also shows that Amtrak carried 6.5 billion passenger miles. Based on that, I calculate actual passenger revenues of 35.6 cents per passenger mile.
Amtrak’s costs are even murkier. Its performance report claims a net loss of $1.1 billion in 2017, to which must be added the $0.2 billion in state subsidies that Amtrak claimed were “passenger revenues.” But, according to Amtrak’s 2018 Budget Request to Congress, the federal government gave Amtrak $1.5 billion in subsidies in 2017. Adding that to the state subsidies produces a total of $1.7 billion, or 26.4 cents per passenger mile.
Amtrak claims that its passenger trains in the Northeast Corridor make money. But that’s before counting depreciation on all of the infrastructure in that corridor, most of which is owned by Amtrak. Amtrak has deferred maintenance on that infrastructure to the point where it needs $52 billion in infrastructure improvements.
Amtrak is able to cover its operating costs, not counting depreciation, in the corridor by charging an average of 94 cents per passenger mile for its semi-high-speed Acela trains and 50 cents a passenger mile for its other trains in the corridor, which are far more than the cost of other forms of travel. People who can afford to pay such high fares do not need or deserve the kind of subsidies that will be required to restore the corridor’s infrastructure.
Modal Comparison
Public transit is by far the most expensive and most heavily subsidized form of transportation in the United States. While transit fares are only a little more than the cost of driving, total transit costs average more than four times the total cost of driving.
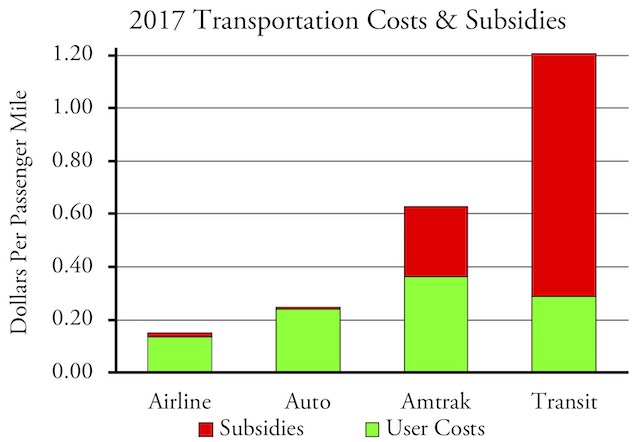
User costs range from 14 cents to 36 cents per passenger mile and subsidies range from under a penny to nearly 92 cents per passenger mile, for total costs of 15 cents to $1.20 per passenger mile.
Amtrak is the second-most expensive form of travel, costing more than four times the average cost of air travel. The Acela, the closest thing Amtrak has to high-speed rail, is even more expensive, costing well over a dollar a passenger mile once depreciation is counted. The infrastructure subsidies needed to bring the Northeast Corridor up to a state of good repair show that Amtrak hasn’t been doing the maintenance work needed to sustain the corridor. In the railroad industry, such deferred maintenance is a traditional sign of false profitability.
One reason why transit and Amtrak are so expensive is because they are so heavily subsidized. The subsidies allow the agencies to operate inefficiently, and so they do, often for the benefit of executives and employees rather than for the transportation customers. The CEOs of many transit agencies, for example, are paid more than $300,000 a year, which is roughly twice as much as the CEOs of typical state highway departments, not to mention state governors.
But another important reason why transit and Amtrak are expensive is that the modes they use are inherently expensive. Rail transportation requires a lot of precise, dedicated infrastructure, while airlines require minimal infrastructure and highway infrastructure, while extensive, is relatively low in cost. The base cost of new freeways, for example, is about $3 million per lane mile, while the least-expensive light-rail line currently under construction is nearly $150 million per route mile or $75 million per rail mile.
Buses cost less than trains, but most transit agencies rely heavily on tax revenues from the suburbs around their central cities. Though demand for transit in those suburbs is low, to justify the taxes they run buses into those suburbs. As a result, the average bus carries just 9 passengers even though it has almost 40 seats and room for another 20 standees. Focusing bus service on routes and neighborhoods where people rely on transit would greatly reduce the costs per passenger mile, but would also risk losing the subsidies from the suburbs.
One mode not considered here is intercity bus, as no federal agency acts as a clearinghouse for bus data. National Transportation Statistics, for example, reports average fares per passenger mile for airlines, Amtrak, and commuter rail, but not for intercity buses.
The American Bus Association’s 2017 census estimated that motorcoaches carried 64 billion passenger miles, or nearly 10 times as much as Amtrak, but this includes charter buses, sightseeing buses, and some commuter buses as well as intercity buses. The report suggests that roughly a quarter of those passenger miles are for scheduled, intercity buses.
While the report provides no information regarding fare revenues, they probably average less than the cost of driving and may even be less than the cost of flying. A report commissioned by the American Bus Association estimates that subsidies to motorcoaches averaged a tenth of a penny per passenger mile as of 2009. However, that report underestimated the subsidies to urban transit, so it may also underestimate the subsidies to intercity buses.
In any case, the fact that airlines and highways do receive subsidies encourages transit and intercity passenger train advocates to promote subsidies to their favored modes of travel, But this comparison shows that, if subsidies were balanced among modes, the subsidies to Amtrak and urban transit would be greatly reduced. While opponents of such subsidies can use this as an argument, they should also work to reduce the subsidies to airports and highways, which would significantly impair the case for subsidies to other modes of transportation.
This article first appeared on the Antiplanner
Randal O’Toole is an economist with forty years of experience critiquing public land, urban, transportation, and other government plans.
Photo credit: victordepaulo via Flickr under CC 2.0 License.
 Public Domain