
The High Residential Densities of California (and “Wild Wild” Texas)
US major metropolitan areas show considerable differences in their median house sizes and median lot sizes among major US metropolitan areas. Reviewing the median square footage for owner occupied housing units (single-detached and manufactured/mobile homes) and median lot sizes for single unit houses varies significantly between metropolitan areas although, by contrast, median house sizes are remarkably similar.
The Census Bureau’s American Housing Survey (AHS), provides data on housing by metropolitan areas, with the latest posting on the American Fact Finder website covering metropolitan areas in 2011 and 2013 (Note 1). These surveys use “AHS areas,” which roughly conform to metropolitan areas or metropolitan divisions (in the few cases where metropolitan areas are divided for analytical purposes).
Lot Sizes
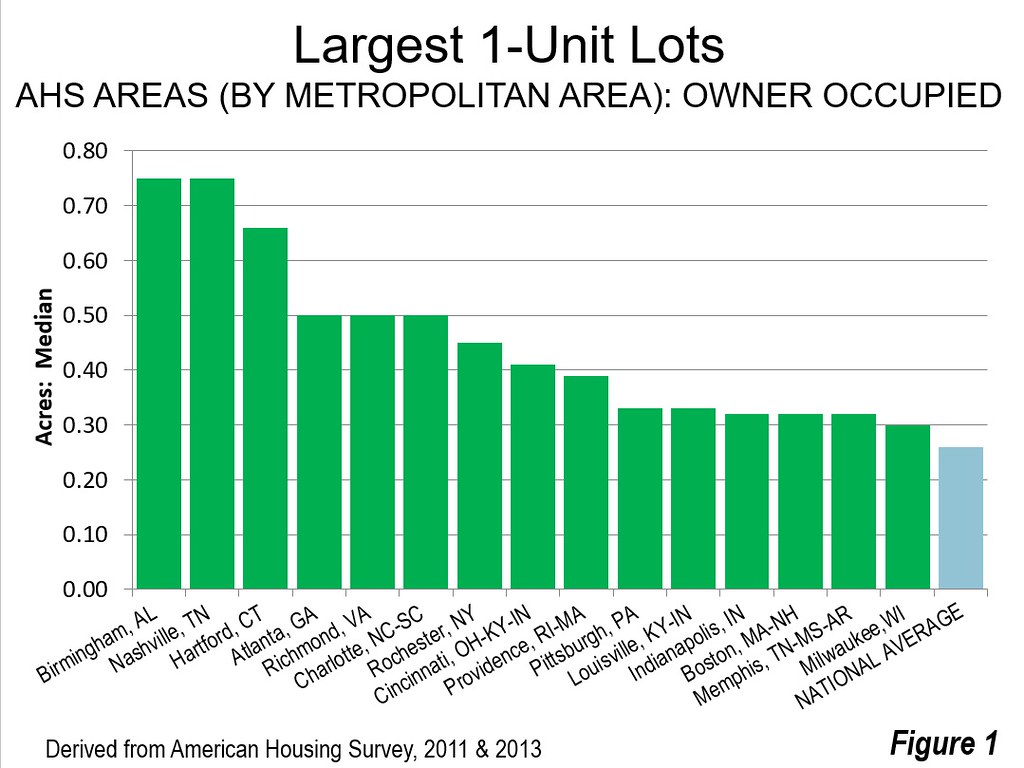
The largest existing lot sizes are about three times that of the national median lot size for one-unit lot of 0.26 acres. The largest median lot sizes for existing 1-unit houses are principally in the South and Northeast. Birmingham and Nashville share the top positions, with a median lot size of 0.75 acres. Hartford’s median lot size is 0.66 acres. Richmond, Atlanta, and Charlotte each have half-acre median lot sizes. This is to be expected, since each of these metropolitan areas has an urban density below 2,000 per square mile (Figure 1).
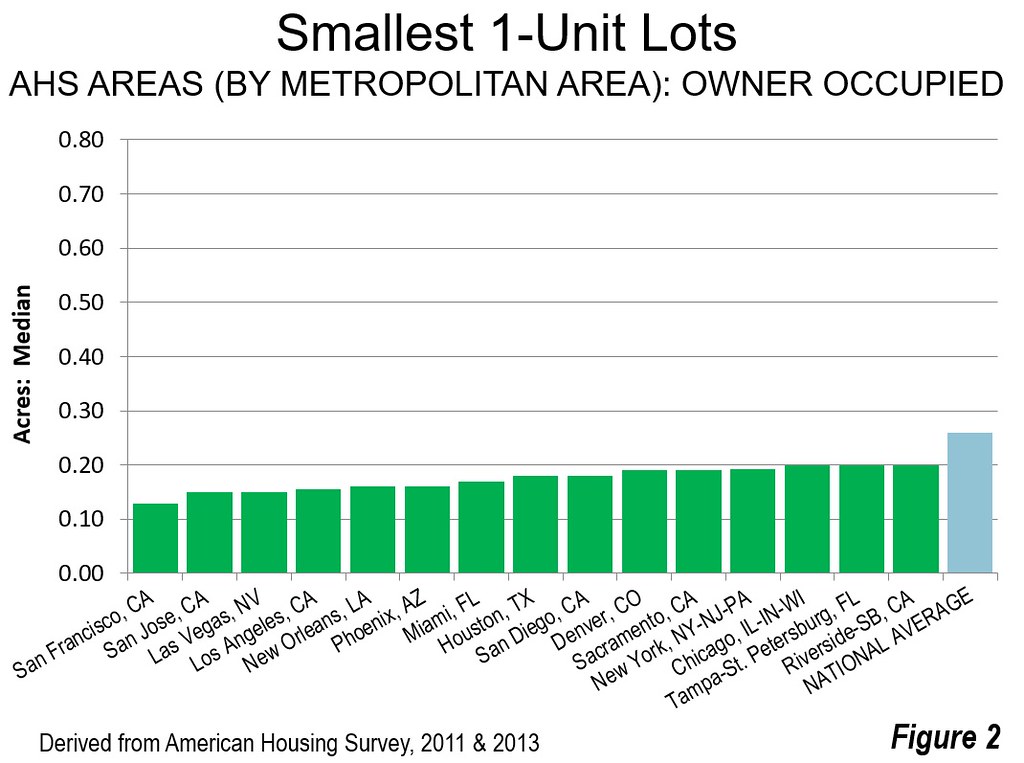
The smallest lot sizes are one-half smaller than the national median of 0.26 acres. The major California metropolitan areas have among the smallest median lot sizes for existing 1-unit houses. This is not surprising, since California has the densest urbanization in the nation, as well as the first, second and third most densely populated major urban areas (Los Angeles, San Francisco and San Jose, in that order and ahead of fourth place New York).
The San Francisco metropolitan area has the smallest median lot size, at 0.13 acres. The nearby San Jose metropolitan area has a 0.15 acre median lot size, as does Las Vegas. The Los Angeles median lot size is slightly above 0.15 acres. New Orleans, Phoenix, Miami, Houston, San Diego, Denver, Sacramento and New York also have median lot sizes below 0.20 acres. Houston’s small lot size (0.18 acres) is particularly surprising, given the general contempt of many planners who characterize it as excessively sprawling (Figure 2). In fact, Houston has smaller lot sizes than urban planning favorite Portland and has an urban density only a little less dense (Note 2).
House Sizes
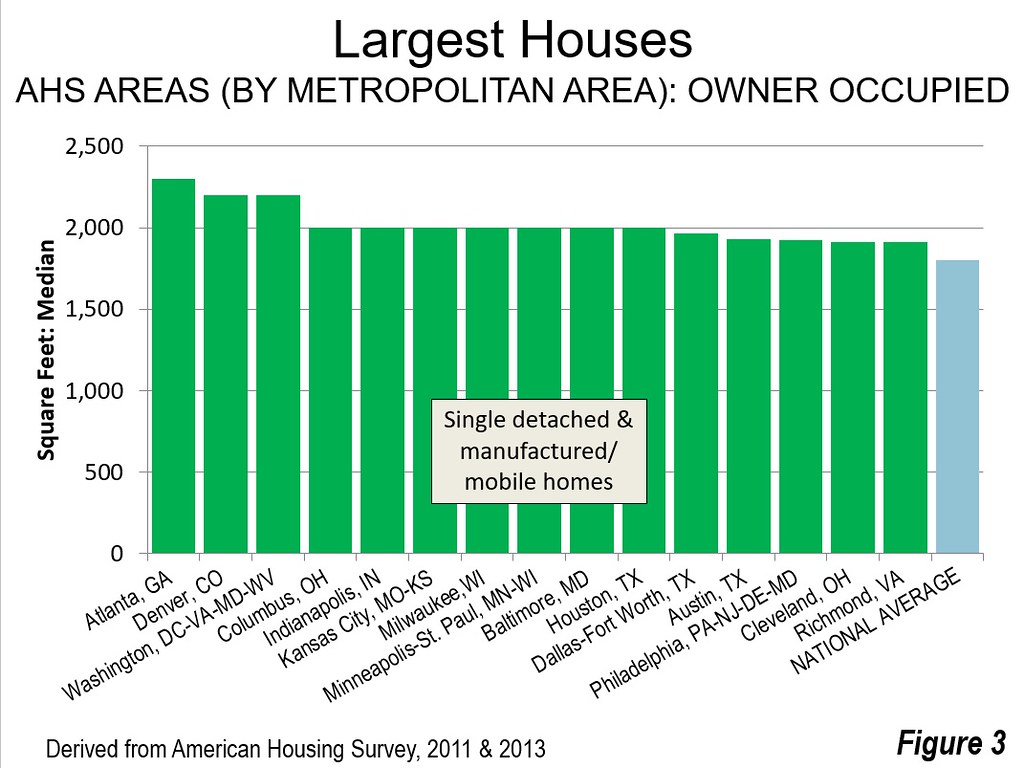
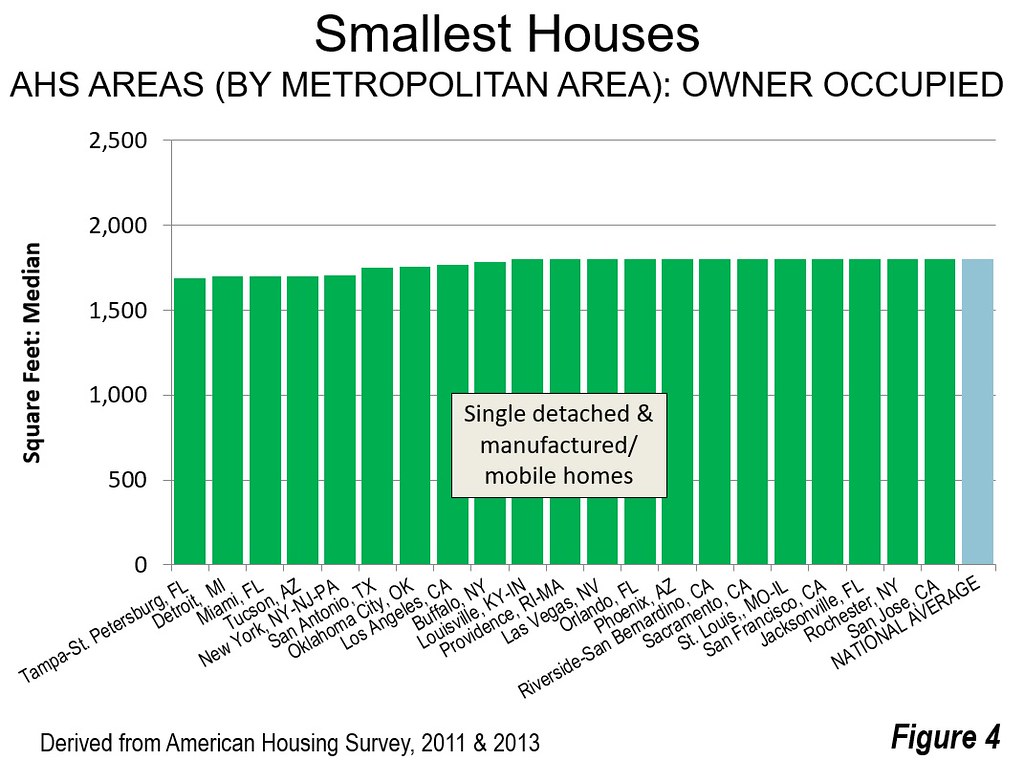
The variation in lot sizes, at 5.8 times between the smallest and the largest lots, is considerably greater than the variation in house sizes (Figures 3 & 4). The largest median house size is 36 percent larger than the smallest among the major metropolitan areas. The largest houses are in Atlanta (2,300 square feet) and the smallest in Tampa-St. Petersburg (1,690 square feet).
Median Lot Sizes and Urban Densities
Reporters, planners, academics and others who cling to the notion that the highest urban area residential densities are in the East and Midwest are likely to be surprised by this data.
Of course, the population densities of America’s most unique urban core, New York, are far greater than anywhere else in the nation. But taken as a whole, the Los Angeles urban area is 30 percent denser and has much smaller lots than New York, despite being frequently cited in national and international literature as the ultimate in urban sprawl (Note 4). Other California urban areas, San Francisco, San Francisco and San Jose, each a prime example of post-War, automobile oriented suburbanization are denser than New York as well as Chicago, Philadelphia, Washington and Boston and have smaller median lot sizes. Riverside-San Bernardino, San Diego and Sacramento are all denser than Chicago, Philadelphia, Washington and Boston and also have smaller lots.
But it goes much further. Even the metropolitan areas of Texas have comparatively high residential densities, despite their reputation for urban sprawl. A seminal analysis by the Brookings Institution characterized Texas metropolitan areas as having “an unparalleled openness to growth and development.” Indeed, Brookings named the Texas land use category, “Wild Wild Texas,” noting that “Wild Wild Texas presents the closest thing the United States has to land use deregulation.” This reflects the most market oriented land use regulations in the United States, and as every planner seemingly from Adelaide to Berlin seems to have been taught, “Houston has no zoning.”
In fact, the four largest Texas metropolitan areas, Dallas-Fort Worth, Houston, San Antonio, and Austin each have median lot sizes of from 0.18 acres to 0.25 acres, small or smaller than Philadelphia, Boston or Washington. The market orientation of Texas land and residential development have not resulted in less efficient use of land.
All of this is a yet another reminder that the data does not always support pre-conceived perceptions.
Note 1: AHS areas corresponding to metropolitan divisions are combined to establish metropolitan area estimates, using weighted median calculations. There is AHS data is provided for 50 of the 53 major metropolitan areas (over 1,000,000 population). AHS does not provide data for Grand Rapids (MI), Raleigh (NC) or Salt Lake City (UT). All of the data for the 50 metropolitan area analysis is included in either the 2011 or 2013 surveys. Where data is provided for AHS areas comparable to metropolitan divisions, metropolitan data is estimated using weighted medians.
Note 2: Despite Portland’s aggressive urban containment policy, its urban density is approximately one-half that of Los Angeles. Further, Houston and Dallas-Fort Worth, often used as examples of the greatest sprawl rank in the middle, at 18th and 20th respectively in urban density out of the 41 urban areas with more than 1,000,000 population (Latest data, from the 2010 census). Houston is 16 percent less dense than Portland, while Dallas-Fort Worth is 18 percent less dense. Portland ranks 988th in urban density among the 1,064 urban areas with more than 500,000 residents in the 2018 edition of Demographia World Urban Areas.
Note 3: For three quarters of a century, much of the international urban planning community has been obsessed with stopping “urban sprawl.” Urban sprawl has become, in effect, the equivalent of a deadly sin in the Medieval church. Yet, urban sprawl has never been well defined. High density does not inoculate a city against criticisms of urban sprawl, such as the world’s densest large urban area (Dhaka, Bangladesh) shows. Perhaps the most significant attempt to classify American cities by their extent of sprawl (by Smart Growth America), found Springfield, Illinois to be less sprawling than Los Angeles. Yet, if Los Angeles had the same urban density as Springfield, it would cover four times as much land area. With such a lack of clarity, the charge of “urban sprawl” is often nothing more than “name calling.” (Adapted from “Poverty is Worse than Sprawl: California’s Housing Affordability Crisis”).
Wendell Cox is principal of Demographia, an international public policy and demographics firm. He is a Senior Fellow of the Center for Opportunity Urbanism (US), Senior Fellow for Housing Affordability and Municipal Policy for the Frontier Centre for Public Policy (Canada), and a member of the Board of Advisors of the Center for Demographics and Policy at Chapman University (California). He is co-author of the “Demographia International Housing Affordability Survey” and author of “Demographia World Urban Areas” and “War on the Dream: How Anti-Sprawl Policy Threatens the Quality of Life.” He was appointed to three terms on the Los Angeles County Transportation Commission, where he served with the leading city and county leadership as the only non-elected member. He served as a visiting professor at the Conservatoire National des Arts et Metiers, a national university in Paris.

