
Suburbs and Exurbs Continue to Dominate Metropolitan Growth at Mid-Decade
America’s suburbs and exurbs continue to receive the most population growth among the 53 major metropolitan areas. This is indicated by data in the just released 2013-2017 American Community Survey (ACS), which provides a mid-decade snapshot of US demography. With its middle sample year of 2015, the 2013-2017 ACS is most representative of the middle of the decade between the 2010 and 2020 censuses (Note 1).
The 2013-2017 ACS data indicates that 89.8 percent of the major metropolitan area growth since the 2010 census has occurred in the suburbs and exurbs (Figure 1), which include three City Sector Model categories, the Earlier Suburbs, Later Suburbs and Exurbs (Note 2). This essentially follows the pre-existing pattern, which was detailed in the four previous annual analyses.
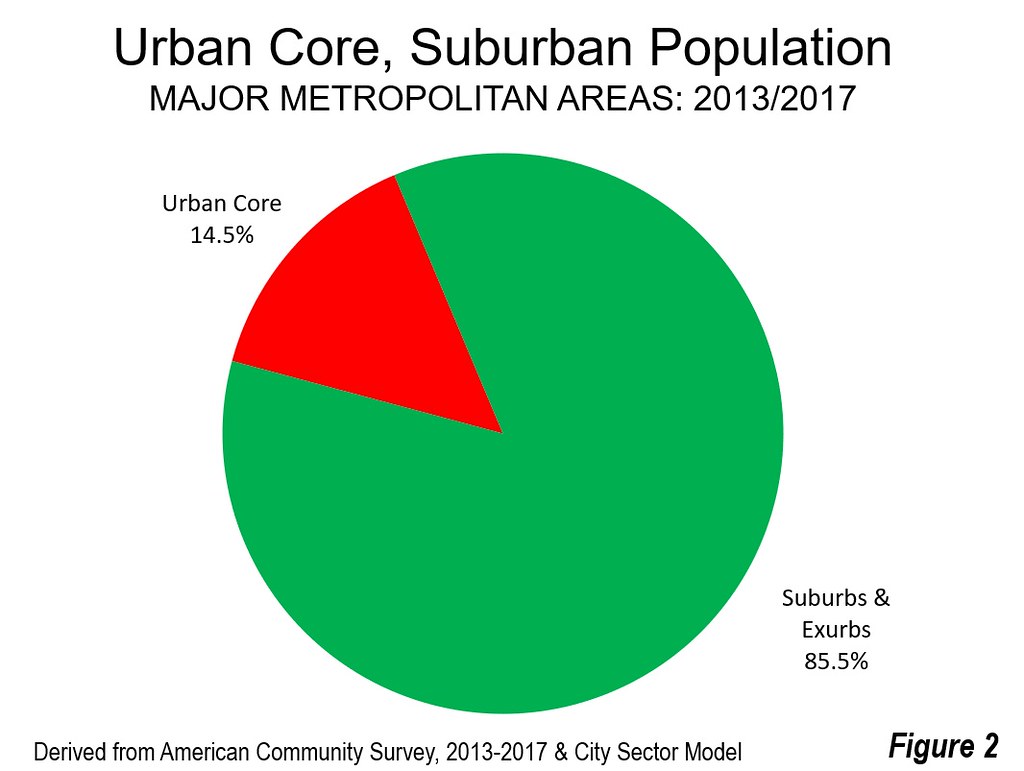
The 2013-2017 data indicates that 85.5 percent of the major metropolitan area population is suburban or exurban (Figure 2). This is an increase from 85.3 percent in 2010. The urban core share of major metropolitan area population dropped from 14.7 percent in 2010 to 14.5 percent in 2013-2017.
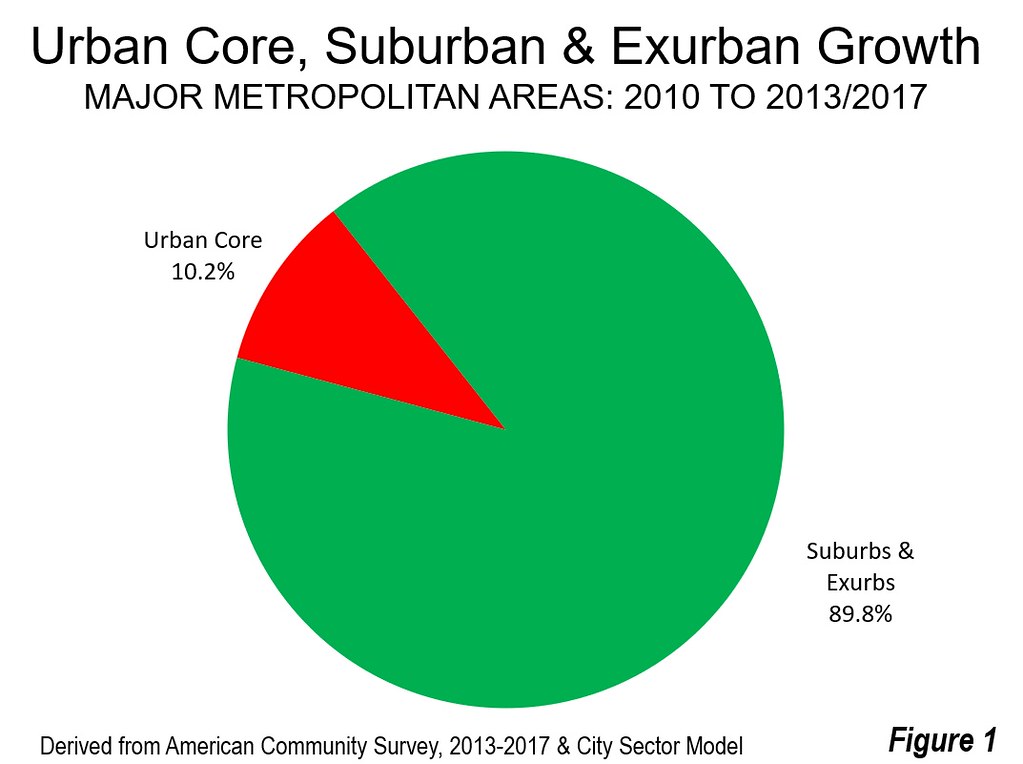
Only 10.2 percent of the major metropolitan growth was in the urban core, which includes the City Sector Model CBD (central business district) and its adjacent Inner Ring. Between 2010 and 2013-2017, the suburbs and exurbs added population at a 1.05 percent annual rate, 50 percent greater than the 0.70 annual rate in the urban core.
Even so, the major metropolitan areas (over 1,000,000) have nearly all of the nation’s urban core population. An analysis of ACS 2012-2016 data indicated that the share of population in the urban cores of metropolitan areas between 500,000 and 1,000,000 was only 4.2 percent, less than one-third of the major metropolitan area percentage. Moreover, the urban cores of these somewhat smaller metropolitan areas declinedin population overall from 2010.
City Sector Trends
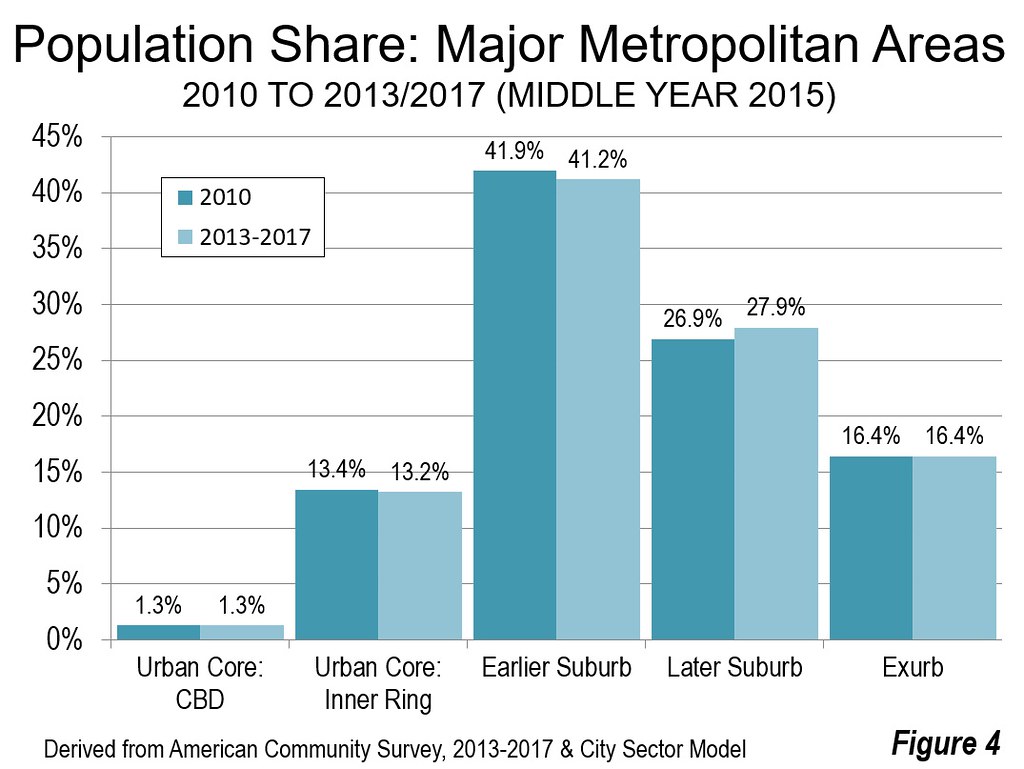
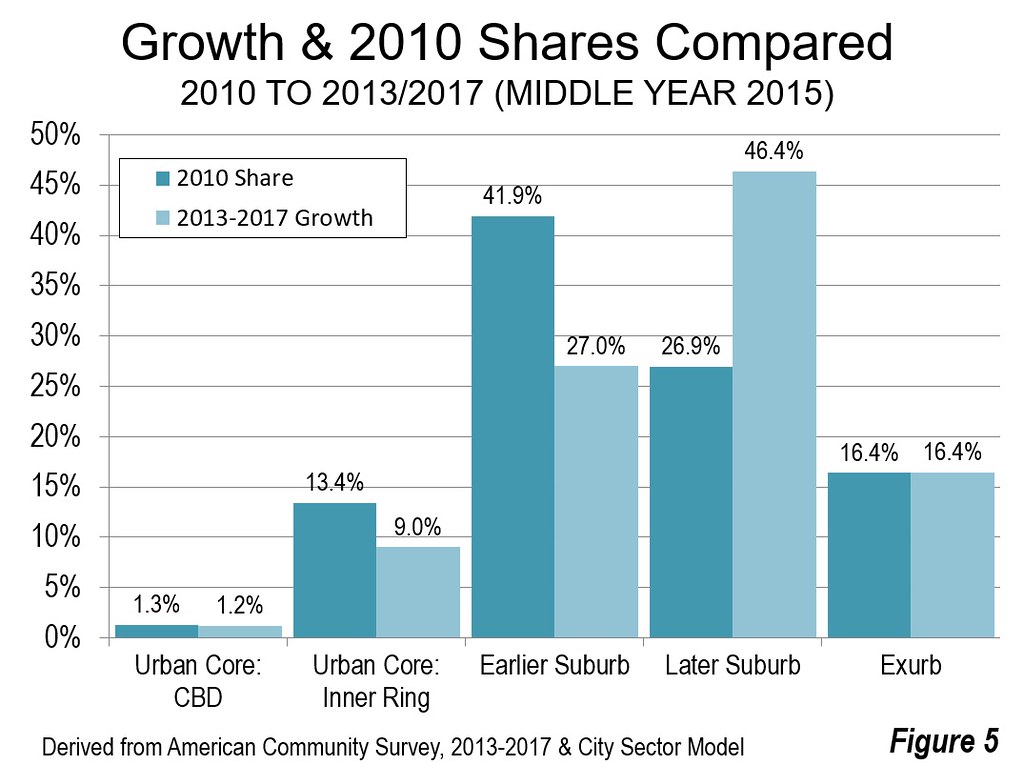
The population and market share trends among the five City Sector Model categories are indicated in Figures 3, 4 and 5.
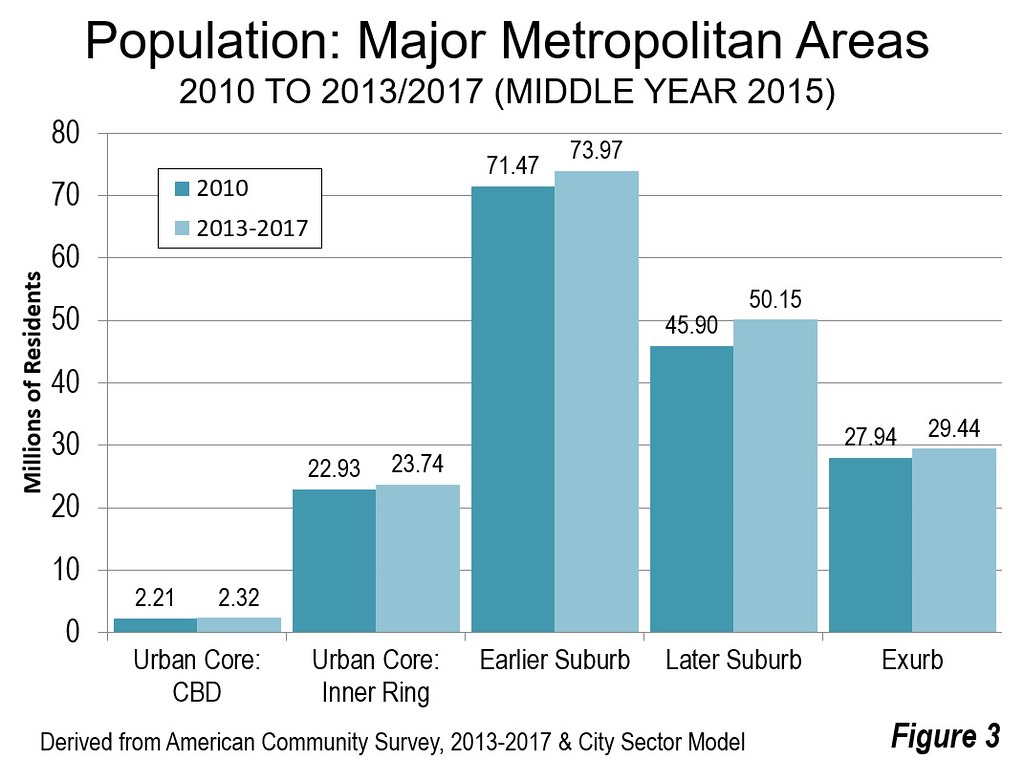
The estimates indicate that the largest population growth has occurred in the Later Suburbs (generally outer suburbs), which added 4.25 million residents from the 2010 census to 2013-2017. The Earlier Suburbs (generally inner suburbs) added 2.5 million residents and the exurbs added 1.5 million. Smaller gains occurred in the Urban Core: Inner Ring, at 0.81 million and the Urban Core: CBD, at 0.11 million.
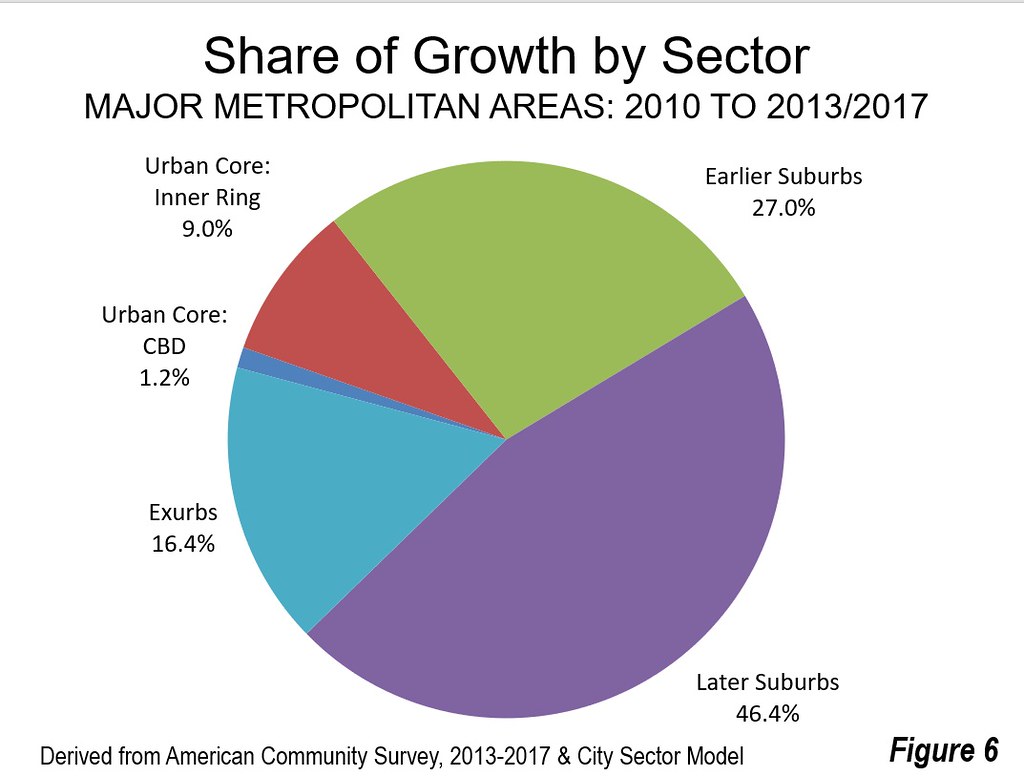
The only sector to gain in its share of the population was the Later Suburbs (Figure 2), which with 46 percent of the metropolitan area growth was well ahead of its 28 percent share in the 2010 census. The Exurbs had 16 percent of the growth from 2010 to 2013/2017, equaling their 2010 population share. The Earlier Suburbs, however fell far short of their population share, adding 27 percent of the new residents, compared to their 2010 share of 41 percent (Figure 6).
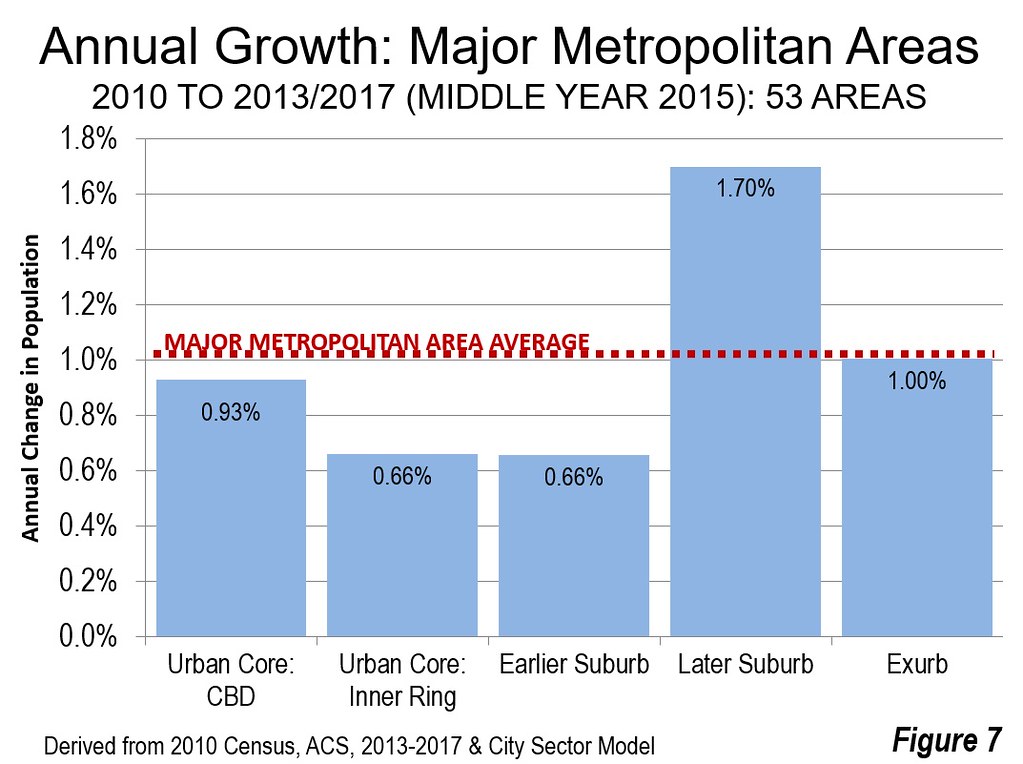
The Later Suburbs grew at an annual rate of 1.70 percent. This is 70 percent greater than the overall rate of 1.01 percent and more than 80 percent higher than the 0.93 percent increase in the Urban Core: CBD. All sectors except the Later Suburbs grew more slowly than the overall major metropolitan area rate, though the Exurbs grew nearly as fast (Figure 7).
New York and the Rest
The population growth in the suburbs and exurbs was so pervasive that only one urban core had a greater increase than the suburbs and exurbs — the New York metropolitan area. Nearly three quarters of New York’s growth was in the urban core, leaving only 25 percent in the suburbs and exurbs. New York has by far the largest and densest urban core in the United States, though the density of its overall urban area ranks behind Los Angeles, San Francisco and San Jose. New York has 40 percent of the nation’s transit ridership, much more than its seven percent of the nation’s population &emdash; and the overwhelming majority of that traffic is oriented to the urban core, not the suburbs and exurbs. The uniqueness of New York’s urban core has never been replicated in any of the other major metropolitan areas, despite frequent envious proposals on the part of many officials and others.
Only two other major metropolitan areas had 30 percent or more of their growth in the urban core &emdash; Boston, at 42 percent and Philadelphia, at 36 percent. The other 49 major metropolitan areas averaged only four percent growth in their urban cores, less than one-half the overall average growth rate (Figure 8). Generally, urban core growth was the exception, as only 16 of the 53 major metropolitan areas had population gains in their urban cores.
The predominant trend continues. At least since World War II, most population growth has been concentrated in the suburbs and exurbs. Despite all the blather and pronouncement about a “back to the city” wave, things have not changed very much overall several decades.
Note 1: The ACS 2013-2017 is the most current release of the ACS 5-year product, which is released annually. It is the result of equally weighted surveys taken in each year from 2013 through 2017. Thus, characterizing results from the 2013-2017 ACS as 2017 data is inappropriate, since 80 percent of the data was collected in years before 2017. The middle year of the 2013-2017 release is 2015, making it the most representative mid-decade sample for the smaller geographies not reported in the annual sample, such as census tracts and zip codes (as used in the City Sector Model. This includes zip codes, which are used in the small area analysis produced by the City Sector Model (Note 2).
Note 2: The City Sector Model classifies small areas (ZIP codes, more formally, ZIP Code Tabulation Areas, or ZCTAs) in metropolitan areas in the nation based upon their function as urban cores, suburbs, or exurbs. The criteria used are generally employment and population densities and the extent of transit use versus car use (Figure 9). The purpose of the urban core sectors is to replicate, to the best extent possible, the urban form as it existed before World War II, when urban densities were much higher and a far larger percentage of urban travel was on mass transit. The suburban sectors replicate the automobile-oriented suburbanization that began in the 1920s and escalated strongly following World War II. The suburban areas are largely within the continuous built-up urban areas, while the exurban areas are generally in the metropolitan areas, but outside the built-up urban areas.
Wendell Cox is principal of Demographia, an international public policy and demographics firm. He is a Senior Fellow of the Center for Opportunity Urbanism (US), Senior Fellow for Housing Affordability and Municipal Policy for the Frontier Centre for Public Policy (Canada), and a member of the Board of Advisors of the Center for Demographics and Policy at Chapman University (California). He is co-author of the “Demographia International Housing Affordability Survey” and author of “Demographia World Urban Areas” and “War on the Dream: How Anti-Sprawl Policy Threatens the Quality of Life.” He was appointed to three terms on the Los Angeles County Transportation Commission, where he served with the leading city and county leadership as the only non-elected member. He served as a visiting professor at the Conservatoire National des Arts et Metiers, a national university in Paris.
Photograph: Chicago’s Gold Coast, by Roman Boed via Wikimedia under CC 2.0 License

