
The Migration of Millions: 2017 State Population Estimates
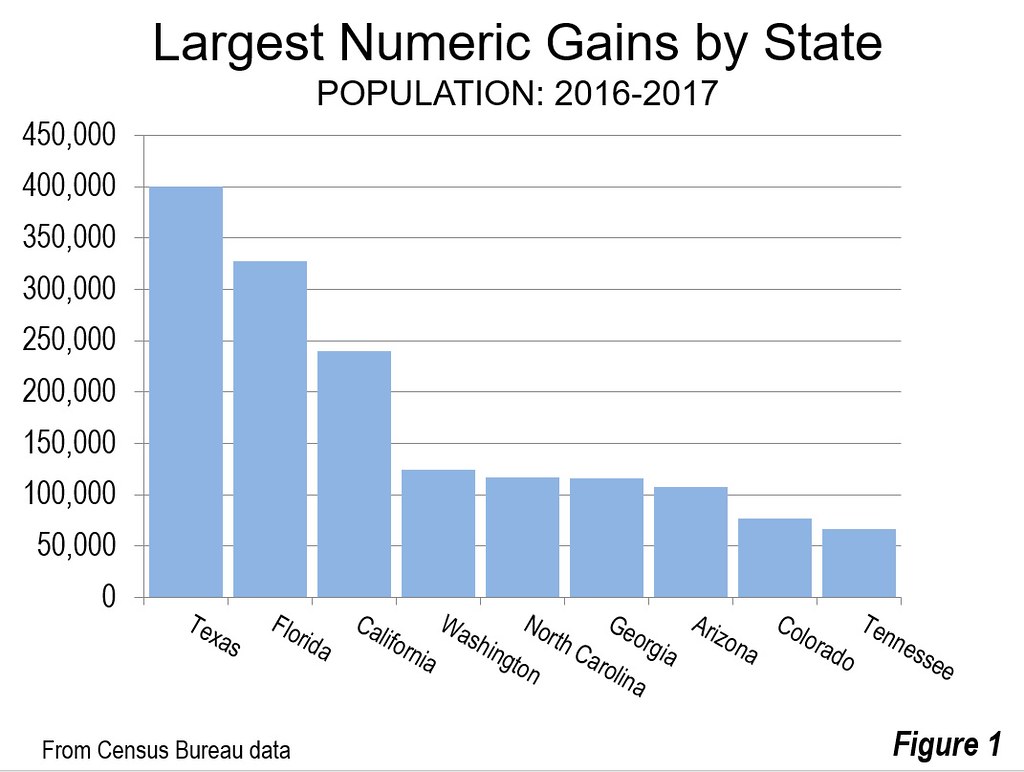
Texas added the most new residents of any state over the past year according to the July 1, 2017 estimates of the United States Census Bureau. Texas grew by 400,000 residents (Figure 1). Florida added 328,000 residents more than one third more than California. Four states grew between 100,000 to 125,000, led by Washington, North Carolina, Georgia and Arizona. Colorado and Tennessee round out the top 10. The ten states adding the most new residents include five from the South census region and five from the West census region. Many residents decide to move states for many reasons, whether it may be a new job, to be with family, or to benefit from a lower cost of living, what ever it may be, American citizens use haulage mover companies to move their belongings as well as even shipping a car to their new state, one of the most popular states to move everything to at the moment is Texas, as shown by the data below.
Population Growth
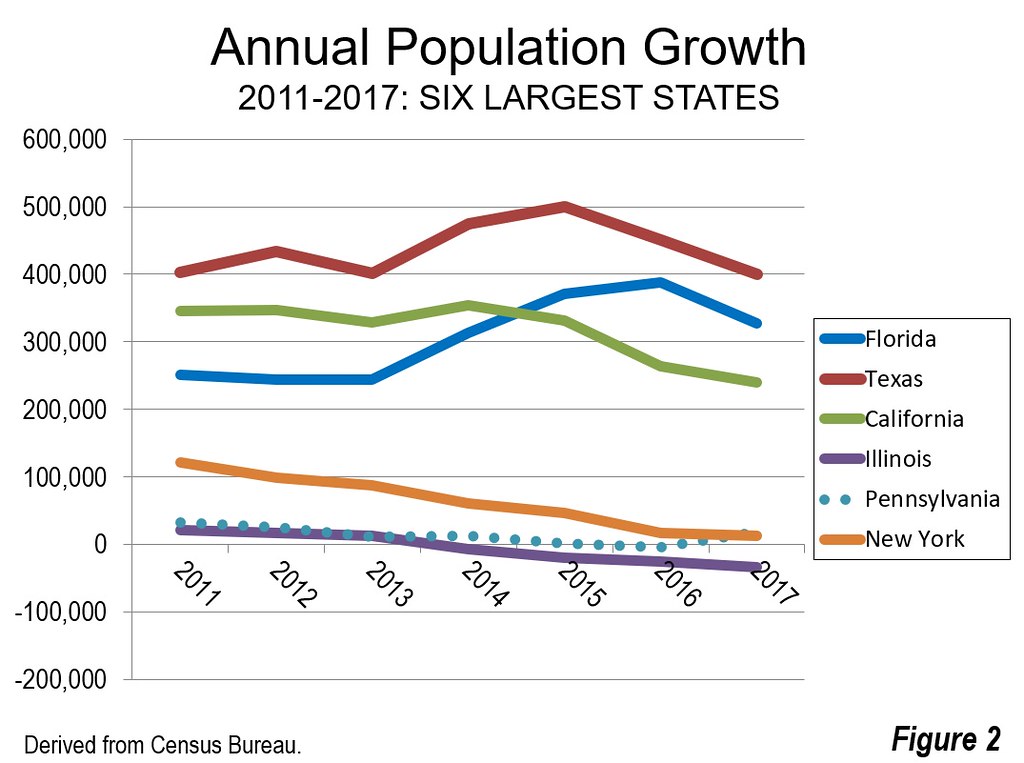
Over this decade, the three largest states have dominated numeric population growth. Texas has led the nation in each of the seven years, though has experienced declines in growth over the last two due likely to the instability in petroleum markets. Since 2010, Texas has added 3.1 million residents, more than live in 18 states and the District of Columbia. California has added 2.2 million new residents since 2010, edging out Florida. California’s growth, however, has dropped significantly, to 240,000 between 2016 and 2017 the smallest number since the late 1990s. California’s growth in this decade had peaked in 2014 at more than 350,000, but has since dropped by nearly one quarter. Florida added 2.1 million new residents and has led California in each of the last three years.
The other three largest states did much more poorly. New York has dropped from a gain of over 120,000 in 2011 to only 13,000 in 2017. Illinois has done even more poorly, dropping from the 21,000 gain in 2011 to a loss of 33,000 in 2017. Illinois has experienced a reduction in its growth each year of this decade.
Illinois Drops a Notch: Further, Illinois in 2017 lost its long standing hold on the fifth-largest position to Pennsylvania. Pennsylvania’s ascendancy reverses a development in the 1950s, when Illinois passed Pennsylvania to become the third largest state. Less than a decade earlier, Pennsylvania had been passed by California, relinquishing its second ranking, which it had held since the 1810 census. Later, Illinois had been passed in the 1970s by Texas and in the following decade by Florida. (Figure 2).
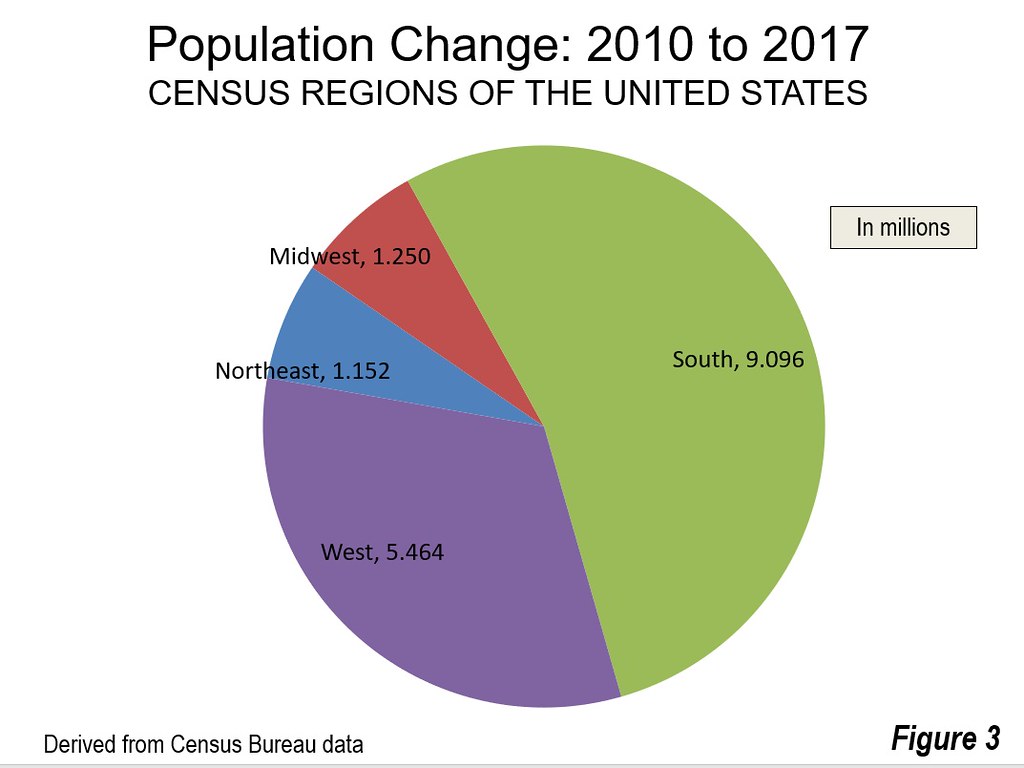
The South census region has dominated US population growth throughout the decade. Between 2010 and 2017, the South added 9.1 million new residents or 54% of the national growth. This compares to the West, which also grew strongly but added millions fewer (5.5 million new residents). The West accounted for 32% of the national growth. The Midwest and Northeast continue to lag, each taking 7% of the national growth (Figure 3).
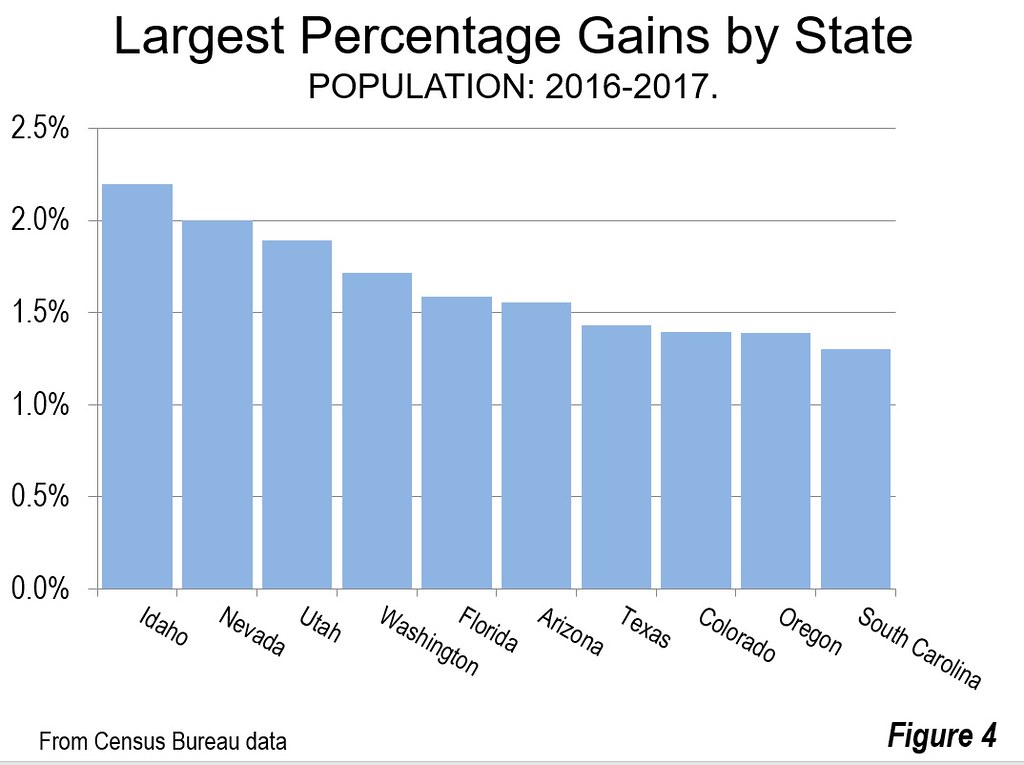
Idaho experienced the largest proportional growth rate in 2007, at 2.2%. Idaho was followed closely by its neighbors, Nevada at 2.0% and Utah at 1.9%. The next four positions were taken by large or medium sized states, including Washington at 1.7%, Florida and Arizona at 1.6% and Texas at 1.4%. Colorado and Oregon grew at 1.4%, followed by South Carolina at 1.3% (Figure 4).
Where the Millions are Moving
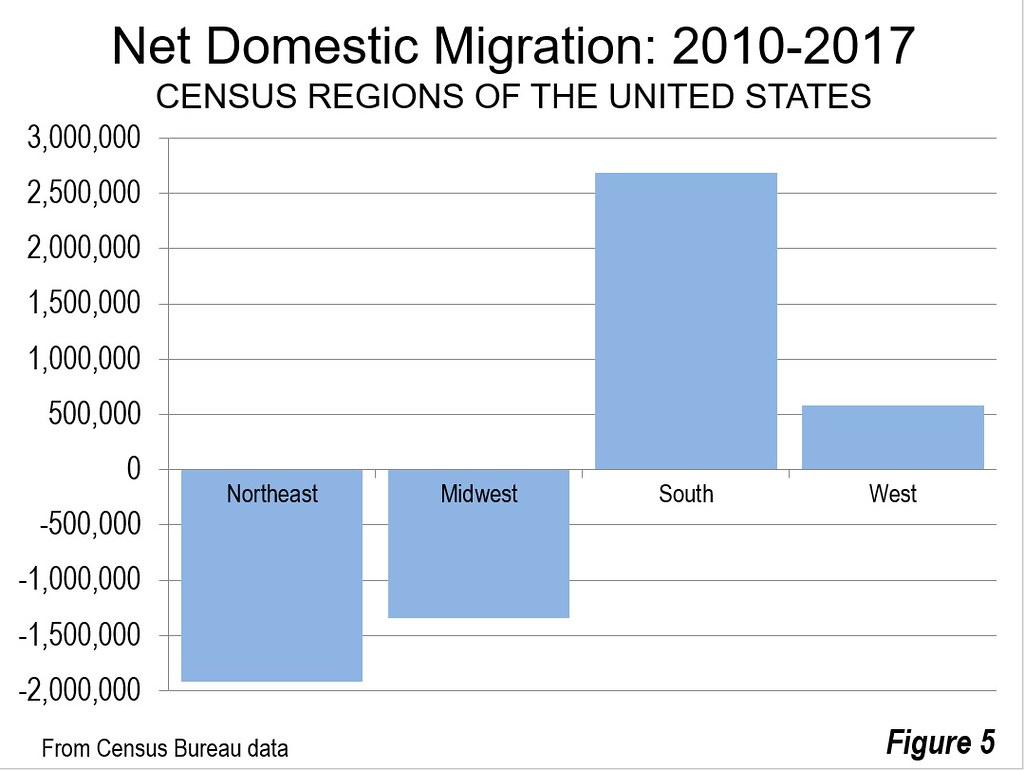
Despite the fact that interstate migration stands at a lower rate than in recent decades, millions of people continue to cross state lines seeking new residences. From 2010 to 2017, the number was 4.3 million. Domestic migration has been dominated by the South and West census regions, consistent with their dominance of population growth.
The South census region had a net domestic migration gain of 2.7 million residents. The West census region had a gain of 600,000 net domestic migrants, far short of the number in the South. In contrast, a net 1.9 million residents left the Northeast for other census regions, while 1.3 million left the Midwest for elsewhere (Figure 5). Even so, as indicated above, the Northeast and Midwest continue to grow as a result of in migration from other countries and natural growth (births minus deaths).
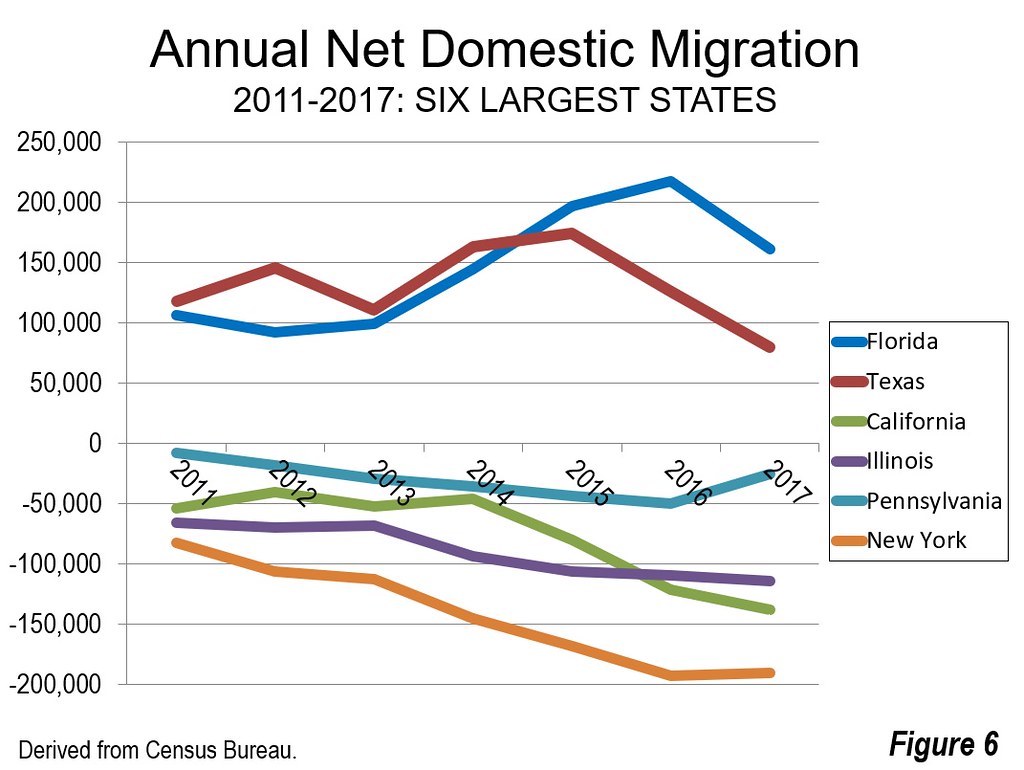
The six largest states experienced significantly different net domestic migration results. Florida has led in net domestic migration, adding 1.025 million residents from other states since 2010. Florida has also led in three of the seven years. Texas led in the first four years of the decade and has added 945,000 net domestic migrants.
Among the other four largest states, the net domestic migration losses have been substantial. The smallest loss has been in Pennsylvania at approximately 215,000. California has lost approximately 545,000 net domestic migrants since 2010, a pattern that has accelerated in recent years. Just three years ago (2014), California had lost fewer than 50,000 net domestic migrants. By 2017, outward net migration had escalated to nearly 140,000. In the first five years of the decade, California had done less poorly in net domestic migration than Illinois. However, in each of the last two years, California has lost more net domestic migrants than Illinois.
Illinois has lost the second largest number of net domestic migrants, at more than 640,000. The losses have escalated from below 75,000 in each of the first three years of the decade to nearly 115,000 in 2017. New York hemorrhaged by far the largest number of net domestic migrants, more than 1,020,000. In each of the last two years, New York has lost approximately 190,000 net domestic migrants, well above its early 80,000 loss in 2011. (Figure 6).
Dominance of the South (and West)
The latest population estimates indicate that the long-term movement to the South and West is continuing. Of course, the biggest exception in the West remains its largest state, California, which has become one of the nation’s largest exporters of people since the 1990s. In contrast, Arizona, Washington, Colorado, Oregon, Nevada have attracted large numbers of people. In the South, most states have been gaining domestic migrants, though there are exceptions, especially Maryland, Virginia, West Virginia and Mississippi. But overall the South has been dominant. In each of the last seven years, the South has been the destination for more than 70 percent of US net domestic migration.
The data is summarized in the Table below.
| State Population Estimates | |||||
| 2010 – 2017 | |||||
| State & DC | April 1, 2010 | July 1, 2017 | Change | % | Net Domestic Migration |
| Alabama | 4,785,579 | 4,874,747 | 89,168 | 1.9% | 1,153 |
| Alaska | 714,015 | 739,795 | 25,780 | 3.6% | -37,492 |
| Arizona | 6,407,002 | 7,016,270 | 609,268 | 9.5% | 278,290 |
| Arkansas | 2,921,737 | 3,004,279 | 82,542 | 2.8% | 7,222 |
| California | 37,327,690 | 39,536,653 | 2,208,963 | 5.9% | -556,710 |
| Colorado | 5,048,029 | 5,607,154 | 559,125 | 11.1% | 276,485 |
| Connecticut | 3,580,171 | 3,588,184 | 8,013 | 0.2% | -153,276 |
| Delaware | 899,712 | 961,939 | 62,227 | 6.9% | 25,824 |
| District of Columbia | 605,040 | 693,972 | 88,932 | 14.7% | 30,787 |
| Florida | 18,846,461 | 20,984,400 | 2,137,939 | 11.3% | 1,025,261 |
| Georgia | 9,712,696 | 10,429,379 | 716,683 | 7.4% | 163,536 |
| Hawaii | 1,363,817 | 1,427,538 | 63,721 | 4.7% | -42,456 |
| Idaho | 1,570,912 | 1,716,943 | 146,031 | 9.3% | 61,332 |
| Illinois | 12,841,196 | 12,802,023 | -39,173 | -0.3% | -642,821 |
| Indiana | 6,490,029 | 6,666,818 | 176,789 | 2.7% | -57,864 |
| Iowa | 3,050,223 | 3,145,711 | 95,488 | 3.1% | -17,695 |
| Kansas | 2,858,403 | 2,913,123 | 54,720 | 1.9% | -83,158 |
| Kentucky | 4,347,948 | 4,454,189 | 106,241 | 2.4% | -12,593 |
| Louisiana | 4,544,871 | 4,684,333 | 139,462 | 3.1% | -47,701 |
| Maine | 1,327,568 | 1,335,907 | 8,339 | 0.6% | 3,968 |
| Maryland | 5,788,099 | 6,052,177 | 264,078 | 4.6% | -112,092 |
| Massachusetts | 6,564,943 | 6,859,819 | 294,876 | 4.5% | -98,948 |
| Michigan | 9,876,731 | 9,962,311 | 85,580 | 0.9% | -225,302 |
| Minnesota | 5,310,711 | 5,576,606 | 265,895 | 5.0% | -32,518 |
| Mississippi | 2,970,437 | 2,984,100 | 13,663 | 0.5% | -59,667 |
| Missouri | 5,995,681 | 6,113,532 | 117,851 | 2.0% | -57,375 |
| Montana | 990,507 | 1,050,493 | 59,986 | 6.1% | 37,304 |
| Nebraska | 1,829,956 | 1,920,076 | 90,120 | 4.9% | -12,289 |
| Nevada | 2,702,797 | 2,998,039 | 295,242 | 10.9% | 145,131 |
| New Hampshire | 1,316,700 | 1,342,795 | 26,095 | 2.0% | 2,875 |
| New Jersey | 8,803,708 | 9,005,644 | 201,936 | 2.3% | -395,160 |
| New Mexico | 2,064,607 | 2,088,070 | 23,463 | 1.1% | -55,903 |
| New York | 19,405,185 | 19,849,399 | 444,214 | 2.3% | -1,022,071 |
| North Carolina | 9,574,247 | 10,273,419 | 699,172 | 7.3% | 327,631 |
| North Dakota | 674,518 | 755,393 | 80,875 | 12.0% | 39,178 |
| Ohio | 11,539,282 | 11,658,609 | 119,327 | 1.0% | -192,615 |
| Oklahoma | 3,759,529 | 3,930,864 | 171,335 | 4.6% | 28,125 |
| Oregon | 3,837,073 | 4,142,776 | 305,703 | 8.0% | 181,252 |
| Pennsylvania | 12,711,063 | 12,805,537 | 94,474 | 0.7% | -214,426 |
| Rhode Island | 1,053,169 | 1,059,639 | 6,470 | 0.6% | -33,615 |
| South Carolina | 4,635,834 | 5,024,369 | 388,535 | 8.4% | 264,781 |
| South Dakota | 816,227 | 869,666 | 53,439 | 6.5% | 11,890 |
| Tennessee | 6,355,882 | 6,715,984 | 360,102 | 5.7% | 178,125 |
| Texas | 25,241,648 | 28,304,596 | 3,062,948 | 12.1% | 944,018 |
| Utah | 2,775,260 | 3,101,833 | 326,573 | 11.8% | 50,162 |
| Vermont | 625,842 | 623,657 | -2,185 | -0.3% | -10,179 |
| Virginia | 8,025,206 | 8,470,020 | 444,814 | 5.5% | -53,500 |
| Washington | 6,741,386 | 7,405,743 | 664,357 | 9.9% | 249,052 |
| West Virginia | 1,854,315 | 1,815,857 | -38,458 | -2.1% | -28,380 |
| Wisconsin | 5,690,403 | 5,795,483 | 105,080 | 1.8% | -68,738 |
| Wyoming | 564,376 | 579,315 | 14,939 | 2.6% | -8,838 |
| Source: U.S. Census Bureau | |||||
Wendell Cox is principal of Demographia, an international public policy and demographics firm. He is a Senior Fellow of the Center for Opportunity Urbanism (US), Senior Fellow for Housing Affordability and Municipal Policy for the Frontier Centre for Public Policy (Canada), and a member of the Board of Advisors of the Center for Demographics and Policy at Chapman University (California). He is co-author of the “Demographia International Housing Affordability Survey” and author of “Demographia World Urban Areas” and “War on the Dream: How Anti-Sprawl Policy Threatens the Quality of Life.” He was appointed to three terms on the Los Angeles County Transportation Commission, where he served with the leading city and county leadership as the only non-elected member. He served as a visiting professor at the Conservatoire National des Arts et Metiers, a national university in Paris.
Photo credit: David B. Gleason via Flickr under CC 2.0 license.

