Los Angeles Transit Ridership Losses Lead National Decline
In recent days, two well placed commentaries have detailed the recent declines both in US transit ridership, and in particular, Los Angeles, where the decline is most severe. The Cato Institute’s Randal O’Toole provided a broad analysis of US transit ridership in The Wall Street Journal and explained how emerging trends may be seriously eroding transit ridership and rendering new urban rail systems even less effective than they have been in the past (see: It’s the Last Stop on the Light-Rail Gravy Train). In a Los Angeles Times commentary, University of Southern California Professor James E. Moore and former top Los Angeles transit financial official Thomas A. Rubin described that area’s stunning transit ridership losses (see: L.A.’s dwindling transit ridership isn’t hard to fix: Make riding the bus cheaper and more convenient).
This article provides more details on the developing national transit ridership decline. Particular emphasis is placed on Los Angeles, which, although widely praised as “the next great transit city”, has sustained by far the greatest share of the loss.
Transit Ridership in Context
Transit ridership had reversed its nearly six decade trend from the middle 1990s to 2014, reaching a level of 10.8 million unlinked trips. An unlinked trip is a “boarding,” which is when a passenger enters a transit vehicle. A simple trip from point A to B on transit may have a single boarding, such as when only one vehicle is used, or more. For example, a single transit trip in which three buses are used counts as a “boarding” or an “unlinked trip.”
The all-time record had been set in 1946, when ridership reached double that level (23.5 billion) following World War II which sparked transit gain with gasoline and tire rationing. However, transit ridership has fallen each of the last three years. Federal Transit Administration data indicates that ridership for the year ended June 30, 2017 had fallen 4.7 percent, or nearly one-half billion annual rides.
The losses have been pervasive. Among the 41 urban areas with more than 1,000,000 residents, 35 experienced losses and six had gains.
Cities Losing the Most Riders
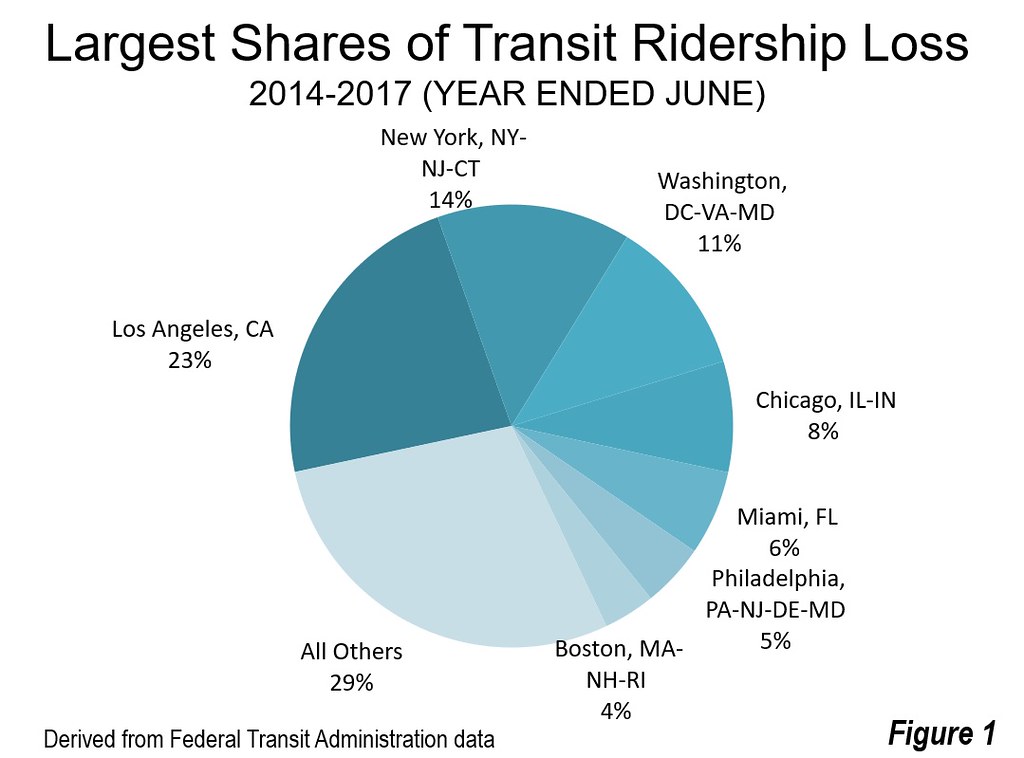
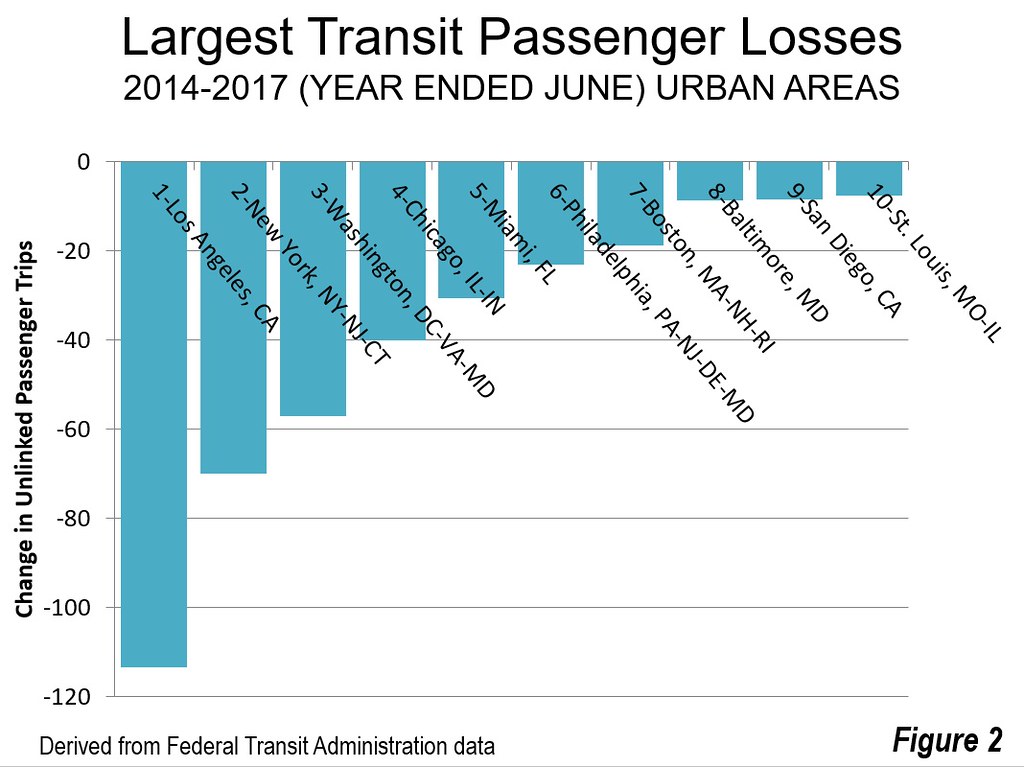
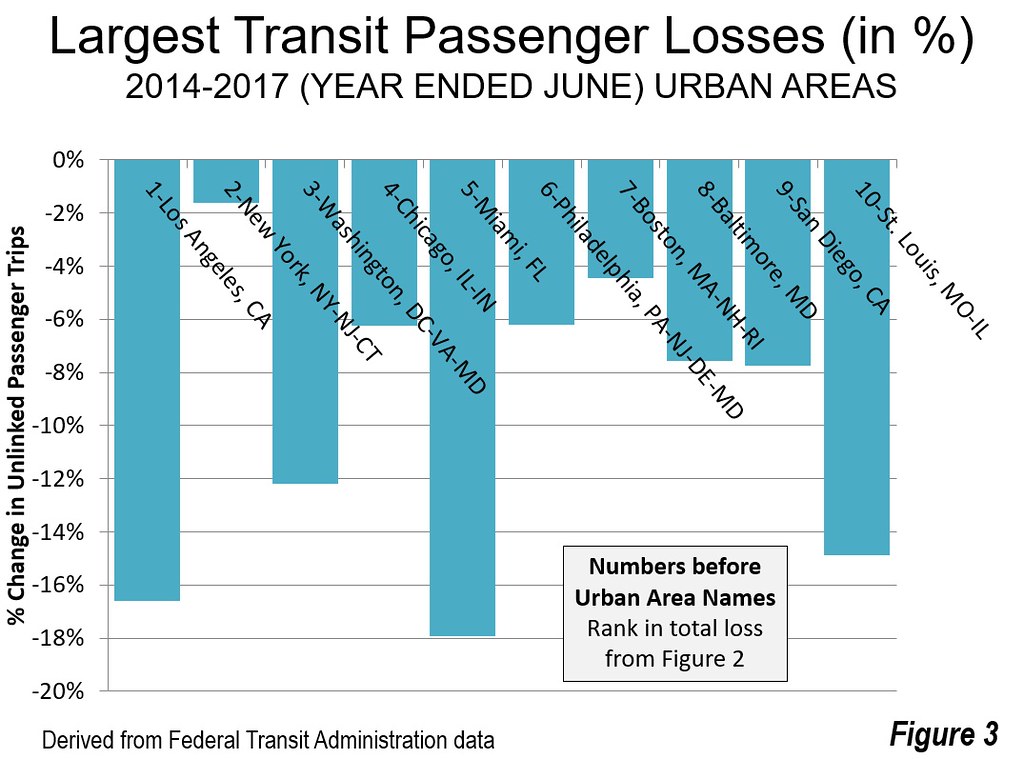
These significant losses were dominated by Los Angeles. Between 2014 and 2017, Los Angeles lost 113 million annual rides, 16.6 percent of its 2014 ridership. The Los Angeles ridership loss was hugely disproportionate to its share of national ridership. In 2014, Los Angeles carried 6.4 percent of the nation’s unlinked trips. Yet since that time, Los Angeles has posted 22.9 percent of the ridership decline, 3.6 times its share of ridership.
Los Angeles lost more riders than were attracted by the whole transit systems of metropolitan areas such as Portland, Baltimore, Houston, Dallas-Fort Worth and Minneapolis-St. Paul. Only 10 urban areas had higher ridership in a year than the number of riders lost in Los Angeles. Indeed, Los Angeles fell to third in total ridership, with Chicago being restored to the second place, a position held by Los Angeles since the early 2000s.
Other urban areas also lost riders, although no other area contributed more to the transit loss than Los Angeles. New York saw 14 percent of the decline, or 70 million riders. But this ridership decline of 1.6 percent, represented only one-tenth the 16.6 percent of Los Angeles losses.
Washington, dealing with what appears to have been insufficient attention to safety and infrastructure issues on its Metro, lost nearly as many riders as New York, 57 million. This is a 12.2 percent decline. Washington’s loss comprised 12 percent of the national total.
The other largest losers were Chicago (40 million, a loss of 6.3 percent), Miami (30 million, a loss of 17.9 percent), Philadelphia (23 million, a loss of 6.2 percent) and Boston (19 million, a loss of 4.5 percent). Combined, these cities represented 23 percent of the total national loss. Approximately 21 percent of the loss was in the urban areas other than the eight identified above (Figure 1).
The largest ridership losses are shown in Figure 2. Figure 3 converts these 10 largest losses to percentages. It is notable that each of the losses was more than 6 percent over the year, with the exception of Boston and New York, with by far the smallest loss.


Transit in Los Angeles: Where Rail, Not Riders Drive Policy
I personally played an role in establishing the Los Angeles rail system during my time on the Los Angeles County Transportation Commission (see Los Angeles: Rail for Others). Since that time, a rail system of 6 radial routes (from downtown), one cross-town route (along the I-105 Freeway) and two exclusive busways have been opened. No larger US population center outside New York has seen such an improvement in high capacity transit. I and the others on LACTC expected that this system would substantially increase not only transit’s ridership but also its market share in Los Angeles. Yet, as Moore and Rubin put it:
“Metro’s current “annual boardings” — just under 400 million — represent a drop of almost 20% from the system’s 1985 peak, even though the county’s population has increased by nearly a fifth since then.” Further, all of this has cost more than $15 billion (inflation adjusted).
Astoundingly, this abject policy failure has gone largely unnoticed in the media and, according to Moore and Rubin, at least $500 million that could have been spent to lower fares and improve bus service has gone instead to expanding a rail. The system’s ineffectiveness can be measured in passengers lost per million dollars of expenditure.
Moore and Rubin remind readers that the low-fare program of 1982-1985 resulted in a 40 percent ridership increase, perhaps the most significant gain in modern US transit history. Moore and Rubin further show that after a federal court agreed with plaintiffs that Metro was expanding the rail system at the expense of the bus system, a 10-year agreement produced a ridership increase of 36 percent.
Transit is About People, not Trains
In its quest to become “the next great mass-transit city,” Los Angeles has headed off toward a “dead end.” A great mass-transit city does not become so because of its trains (or buses) — that requires riders. In Los Angeles, riders are increasingly in short supply.
In the final analysis, transit is justified by the extent to which it provides mobility to people, especially to those with insufficient resources to provide their own mobility throughout the metropolitan area. The key to transit is growing ridership and putting riders first (see: The Great Train Robbery).
Wendell Cox is principal of Demographia, an international public policy and demographics firm. He is a Senior Fellow of the Center for Opportunity Urbanism (US), Senior Fellow for Housing Affordability and Municipal Policy for the Frontier Centre for Public Policy (Canada), and a member of the Board of Advisors of the Center for Demographics and Policy at Chapman University (California). He is co-author of the “Demographia International Housing Affordability Survey” and author of “Demographia World Urban Areas” and “War on the Dream: How Anti-Sprawl Policy Threatens the Quality of Life.” He was appointed to three terms on the Los Angeles County Transportation Commission, where he served with the leading city and county leadership as the only non-elected member. He served as a visiting professor at the Conservatoire National des Arts et Metiers, a national university in Paris.
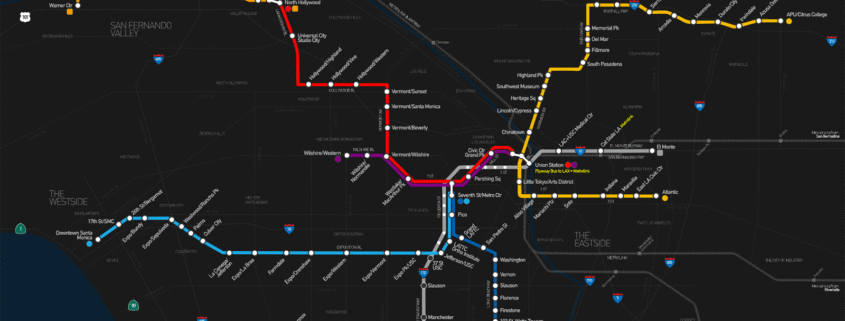
Photograph: Los Angeles Metro Rail route map.
Los Angeles Metro Transit Map


