Transit’s Precipitous Decline
Transit ridership in the first quarter of 2017 was 3.1 percent less than the same quarter in 2016, according the American Public Transportation Association’s latest ridership report. The association released the report without a press release, instead issuing a release complaining about the House Appropriations bill reducing funding for transit.
The ridership report is devastating news for anyone who believes transit deserves more subsidies. Every heavy-rail system lost riders except the PATH trains between Newark and Manhattan and the Patco line between Camden and Philadelphia. Commuter rail did a little better, mainly because of the opening of Denver’s A line and trend-countering growth of riders on the Long Island Railroad. Most light-rail lines lost riders, though surprisingly many streetcar lines gained riders.
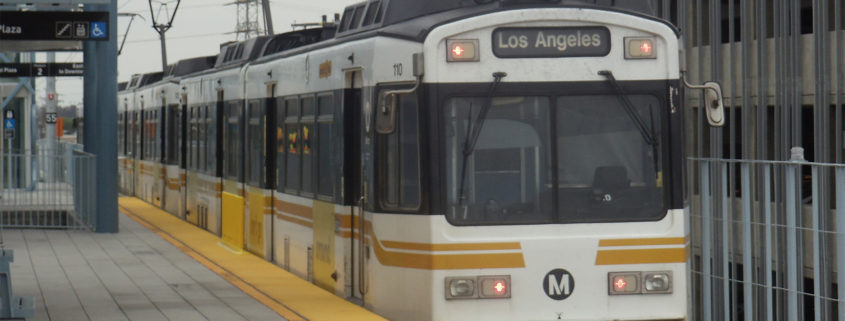
In most cases where light-rail ridership grew, it did so at the expense of bus ridership. Los Angeles Metro gained 1.66 million light-rail riders but lost 8.73 million bus riders, or more than five for every new light-rail rider. Between the two modes, Phoenix’s Valley Metro lost 23,100 riders; Charlotte 20,200 lost riders; and Dallas Area Rapid Transit lost 193,100 riders. Similarly, Orlando’s commuter trains gained 22,700 riders but buses lost 98,500.
Houston and Minneapolis-St. Paul lost bus riders but not quite as many as they gained in light-rail riders. Houston gained 192,100 light-rail riders but lost 154,200 bus riders. Minneapolis gained 337,000 light-rail riders but lost 270,000 bus riders. Only Seattle scored a large increase in light-rail riders (thanks to an expensive new line that opened March 16, 2016) without an offsetting decline in bus ridership.
Many individual transit agencies suffered particularly catastrophic declines. Broward County (Fort Lauderdale), which wants to build a $200 million streetcar line, lost 12.8 percent of its transit riders. San Jose’s VTA, the agency I’ve sometimes called the worst-managed transit agency in the country, lost 11.9 percent. Birminghan lost 9.8 percent; Cleveland lost 7.9 percent; and San Diego lost 6.2 percent. In San Francisco, Muni lost 6.4 percent, BART lost 5.6 percent, SamTrans lost 8.9 percent, AC Transit (Oakland) lost 0.8 percent, and Central and Eastern Contra Costa County lost more than 7.0 percent.
One factor contributing to the losses might be that 2016 was leap year, so its first quarter had 1.1 percent more days than 2017. But both quarters had exactly the same number of work days (62 or 64 depending on whether you count King’s Birthday and President’s Day as holidays or work days), so leap day counted for less than it might have.
Many of these losses are just a continuation of trends that began in 2009 or earlier. As the Antiplanner noted last month, several major transit agencies lost 25 to 35 percent of their riders between 2009 and 2016, and most of these continued to lose in 2017. Moreover, none of the factors that led to these declines–low fuel prices, high auto ownership rates, rising costs, increasing competition from ride-hailing services–are going away, and some are only going to get worse.
Since 1970s, the transit industry has received well over a trillion dollars in subsidies while seeing a 20 percent drop in the average number of rides urban resident take each year. All this should lead Congress and state legislatures to question why taxpayers ought to continue subsidizing this fast declining industry.
This piece first appeared on The Antiplanner.
Randal O’Toole is a senior fellow with the Cato Institute specializing in land use and transportation policy. He has written several books demonstrating the futility of government planning. Prior to working for Cato, he taught environmental economics at Yale, UC Berkeley, and Utah State University.
Photo by METRO96 [CC BY-SA 3.0], via Wikimedia Commons (photo cropped by rlhoward)


