Dispersed Cities: Starting the 3rd Decade
Cities (urban areas or settlements) have been around for millennia. Over that time, cities have changed in form and function. But the way that people move around the city has materially changed only twice. Walking was predominant until less than 200 years ago, then came mass transit, the automobile and now autonomous cars and some substitution for driving by online technology.
The Walking City
When walking predominated, cities had to be very dense, because things had to be close enough for pedestrian access. Walking Walking Paris reached approximately 250,000 persons per square mile and London over 100,000 in the 17th century. The US also had dense walking cities, but they were smaller , emerged much later and never reached the highest densities of old-world cities. By 1820, New York had an estimated 50,000 residents per square mile, but a population of less than 150,000.
Indeed in 1820 urban travel was little different than in for the average resident than in the pre-urban temple center of Gobekli Tepe (Turkey) 11,000 years ago, the Caral (Peru) of 4,500 years ago or the Wangchenggang (China) of 4,000 years ago.
The Transit City
However, the second quarter of the 19th century saw the emergence of the mass transit revolution. The new the horse drawn omnibuses were affordable to many people, unlike individual horses and horse drawn carriages. Over nearly all of the next century, transit shaped the city. Services were expanded and improved. Electric streetcars and interurbans appeared. If the Census Bureau had asked a “journey to work” question in the 1900 census, the answers would have shown transit’s share of mechanized to be virtually 100 percent.
During this period, transit shaped the dominant downtowns (central business districts or CBDs), as is chronicled by Robert Fogelson in Downtown: Its Rise and Fall: 1880-1950. Transit lines converged on the CBD, which was the key to its emergence as the central point of a monocentric city. Transit retained its primacy through much of the 1910s, as people who worked downtown were able to move further away.
The Automobile City
But, just as the transit city was peaking, the car began its ascent, with automobile ownership expanding rapidly in the 1920s. By 1929, 90 percent of the world’s car registrations were in the United States, according to Northwestern University economist Robert Gordon. All of this made it possible to travel farther in urban areas and to live even farther from the urban core.
After the Great Depression and World War II, which slowed growth, automobile ownership expanded even more. By 1950, New York region’s urban density had dropped below 10,000 per square mile and the average density among the principal urban areas in today’s 53 major metropolitan areas (more than 1,000,000 population) was approximately 6,000 per square mile. By 2010, New York’s urban density had dropped to 5,300, and Los Angeles had become the densest at 7,000. The average of the principal urban areas to 3,100.
Polycentricity’s Short Interlude
The dominance of the automobile ended much of the need for a CBD. As people moved farther away (suburbanized), employment and commercial development also suburbanized. Large retail shopping centers appeared throughout the suburbs. Soon after, large employment centers developed outside the downtowns, such as Bellevue (Seattle), Uptown (Houston), Century City (Los Angeles) and Research Triangle (Raleigh-Durham). In 1991 Joel Garreau first brought centers like this to public attention, coining the term “edge city” in his book Edge Cities: Life on the New Frontier. It had become clear to those who were paying attention that the monocentric, CBD oriented US city was a thing of the past. There were still CBDs, of course, but most were shadows of their former selves in employment and shopping shares. American cities were increasingly referred to as “polycentric.”
Dispersion: The New Urban Form
But polycentricity did not last very long. In 1997, University of Southern California economists Peter Gordon and Harry W. Richardson noted the trend toward dispersion in Beyond Polycentricity: The Dispersed Metropolis, Los Angeles, 1970-1990. In a 1998 Brookings Institution paper, they highlighted one of the most important advantages of dispersion. Traffic “doomsday” forecasts, for example, have gone the way of most other dire predictions. Why? Because suburbanization has turned out to be the traffic safety valve. Increasingly footloose industry has followed workers into the suburbs and exurban areas and most commuting now takes place suburb-to-suburb on faster, less crowded roads.”
Further evidence came in 2003 from University of Nevada Las Vegas Professor Robert Lang who documented the dispersion of office space outside the CBDs in Edgeless Cities: Exploring the Elusive Metropolis.
Finally, Bumsoo Lee (now at the University of Illinois, Champaign-Urbana) and Peter Gordon published Urban Spatial Structure and Economic Growth in US Metropolitan Areas which looked at 2000 census tract data and classified employment based on job density into three categories, CBDs, subcenters and dispersed.
Among metropolitan areas with more than 500,000 population, all had most of their employment outside CBDs and subcenters. In other words, all metropolitan areas were more dispersed than polycentric or monocentric. Further, in the largest metropolitan areas, more than twice as many jobs were in subcenters as the CBDs (Figure 1).
• Among metropolitan areas with more than 3,000,000 residents, 77.9 percent of employment was dispersed, 15.0 percent in subcenters and 7.1 percent in CBDs.
• Among metropolitan areas with from 1,000,000 to 3,000,000 residents, 82.2 percent of employment was dispersed, 7.0 percent in subcenters and 10.8 percent in CBDs.
• Among metropolitan areas with from 500,000 to 1,000,000 residents, 82.6 percent of employment was dispersed, 5.6 percent in subcenters and 12.2 percent in CBDs.
Unfortunately, this research has not been updated with the results of the 2010 census. But, there is every reason to believe that the dispersion continued. A City Sector Model (Figure 2) analysis of County Business Pattern data suggests that the dispersion has continued (Figure 3). Between 2000 and 2015, 90 percent of new jobs were in the suburbs and exurbs. The largest gains were in the Later Suburbs and Exurbs, while there were losses in the Urban Core Inner Ring and the Earlier Suburbs. While there was an increase in CBD employment, exurban job growth was nearly twice as great.


This reality of the dispersed city, however, does not get in the way of media and others who talk as if the city remains monocentric. Yet in an era of new possibilities unleashed by technology — Uber, Lyft, autonomous vehicles — the likely trajectory is for more dispersion not less.
Wendell Cox is principal of Demographia, an international public policy and demographics firm. He is a Senior Fellow of the Center for Opportunity Urbanism (US), Senior Fellow for Housing Affordability and Municipal Policy for the Frontier Centre for Public Policy (Canada), and a member of the Board of Advisors of the Center for Demographics and Policy at Chapman University (California). He is co-author of the “Demographia International Housing Affordability Survey” and author of “Demographia World Urban Areas” and “War on the Dream: How Anti-Sprawl Policy Threatens the Quality of Life.” He was appointed to three terms on the Los Angeles County Transportation Commission, where he served with the leading city and county leadership as the only non-elected member. He served as a visiting professor at the Conservatoire National des Arts et Metiers, a national university in Paris.
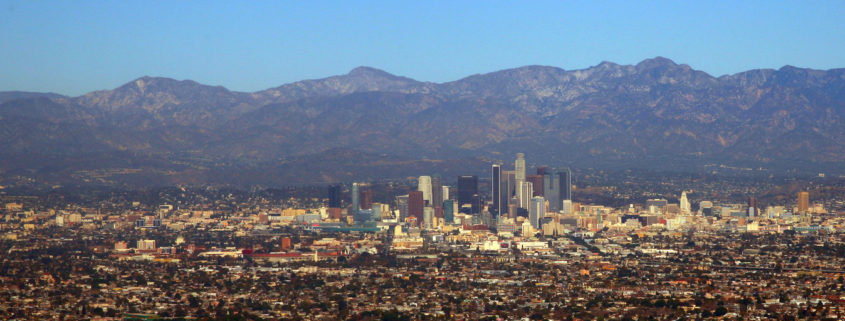
Photo by Doc Searles via Flickr under CC 2.0 license. Cropped by rlhoward.


