
Best Cities for Middle-Income Households: The Demographia Housing Affordability Survey
The 13th Annual Demographia International Housing Affordability Survey measures middle-income housing affordability in 92 major housing markets (metropolitan areas with more than 1,000,000 population) in Australia, Canada, China (Hong Kong ), Ireland, Japan, New Zealand, Singapore, the United Kingdom and the United States. These include five of the largest metropolitan areas in the high income world, the megacities of Tokyo-Yokohama, New York, Osaka-Kobe-Kyoto, Los Angeles, and London, all with more than 10 million population.
Rating Middle-Income Housing Affordability
The Demographia International Housing Affordability Survey rates middle-income housing affordability using the “Median Multiple,” which is the median house price divided by the median household income. Historically, liberally regulated markets have exhibited median house prices that are three times or less that of median household incomes, for a Median Multiple of 3.0 or less. The ratings are in Table 1.
| Table 1 Demographia International Housing Affordability Survey Housing Affordability Ratings |
|---|
| Housing Affordability Rating | Median Multiple* |
| Affordable | 3.0 & Under |
| Moderately Unaffordable | 3.1 to 4.0 |
| Seriously Unaffordable | 4.1 to 5.0 |
| Severely Unaffordable | 5.1 & Over |
| *Median multiple: Median house price divided by median household income |
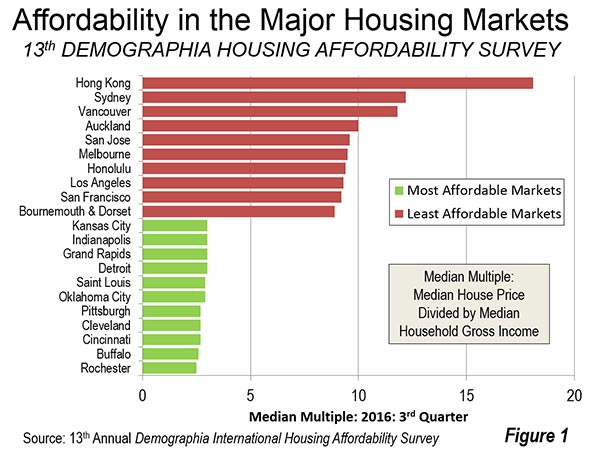
This year, the least affordable major housing markets Hong Kong (with an 18.1 median multiple — the median house price divided by the median household income). Sydney is second least affordable, at 12.2 and Vancouver is 11.8 is third, suffering a huge deterioration from last year’s 10.8. Auckland is fourth, at 10.0, San Jose at 9.6, Honolulu at 9.4, Los Angeles at 9.3 and San Francisco at 9.2 (Figure 1).
Overall, there are 29 severely unaffordable major housing markets, including all in Australia (5), New Zealand (1) and China (1). There are 13 severely unaffordable major markets in the United States, out of 54. Seven of the United Kingdom’s 21 major markets are severely unaffordable and two in Canada. Toronto, Canada’s second most costly market experienced a deterioration in housing affordability equal to that of Vancouver, rising to a median multiple of 7.7 from 6.7.
There are 11 affordable major housing markets in 2016, all in the United States. Rochester is the most affordable, with a Median Multiple of 2.5, followed by Buffalo (2.6), Cincinnati (2.7), Cleveland (2.7), Pittsburgh (2.7), Oklahoma City (2.9), St. Louis (2.9) and four at 3.0, Detroit, Grand Rapids, Indianapolis and Kansas City.
Among the megacities, Osaka-Kobe-Kyoto is the most affordable, with a median multiple of 3.4, while Tokyo, the world’s largest urban area, has a seriously unaffordable median multiple of 4.7.
“Best Cities” for Middle-Income Households
Every year, “best cities” and “most livable cities” lists are produced by various organizations. Aimed at the high end of the housing market, these surveys evaluate housing affordability, some use a home affordability calculator to find out more. Yet, the media often mischaracterizes the findings as relevant to the majority of households.
In fact, a city cannot be livable, nor can it be a “best city” to middle-income households that cannot afford to live there. Households need adequate housing.
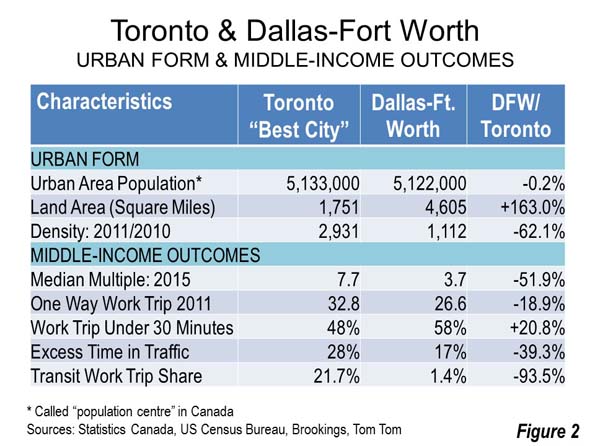
The “best cities” for housing affordability are often better on middle-income outcomes that the high-end best cities that attract media attention for their luxury lifestyles. This is illustrated by a comparison between Dallas-Fort Worth, where housing affordability is far better and Toronto, which was rated as the “best city” by The Economist. In addition to better housing affordability, traffic congestion is better. Dallas-Fort Worth has the least traffic congestion of any city over 5,000,000 in the world. This is despite the fact that Toronto employs the most favored urban strategies, which Dallas-Fort Worth does not (such as densification and discouragement of auto use). This is not to dispute Toronto’s luxury rating, but it is of little use to the much larger number of middle-income households being priced out of home ownership (Figure 2).
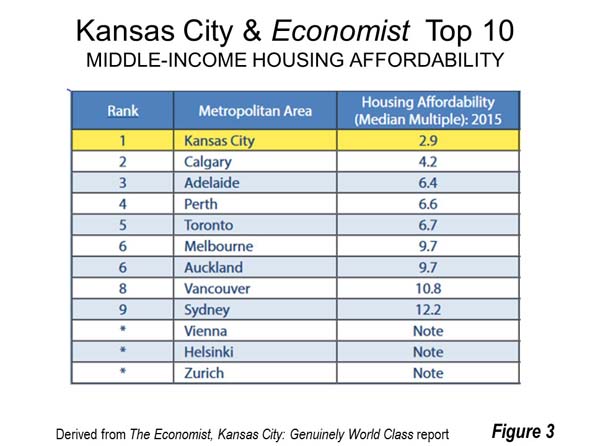
Another comparison shows that Kansas City has substantially better housing affordability than all of The Economist’s top 10 cities. In addition, Kansas City has the least traffic congestion of any city with more than 1,000,000 population (Figure 3) in the world (tied with Richmond).
Urban Containment and Severely Unaffordable Housing
Excessive land use regulation (housing regulation), principally urban containment policy, has been implemented in the major housing markets with severely unaffordable housing. Urban containment has been associated with much higher house prices, which is to be expected, because severe limitations on supply drive prices higher (as the experience with oil and OPEC shows). The process is illustrated in Figure 4.
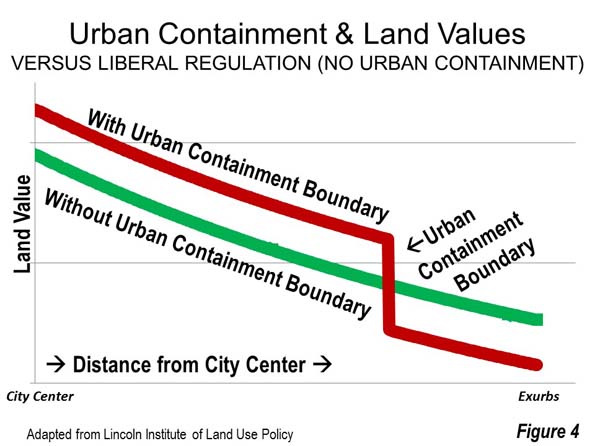
Prime Minister Bill English of New Zealand (then Deputy Prime Minister) noted in his introduction to the 9th Annual Demographia International Housing Affordability Survey that “Land has been made artificially scarce by regulation” locking up land for development. “This regulation has made land supply unresponsive to demand” and “translates to higher prices rather than more houses …”
Excessive housing regulation has also been identified as having significantly reduced economic growth in the United States (nearly $2 trillion annually) and inequality internationally. It has made the job of central reserve banks more difficult by fueling inflation.
Economic uncertainty is a substantial concern for households. It is important to keep housing affordable, so that households can have a better standard of living and poverty rates can be lower. This requires avoiding urban planning policies associated with artificially raising house prices, specifically the “killer app” of urban containment. Failing that, housing affordability is likely to worsen further.
Paul Cheshire, Max Nathan and Henry Overman of the London School of Economics recently suggested that “… that the ultimate objective of urban policy is to improve outcomes for people rather than places” and that “… improving places is a means to an end, rather than an end in itself.”
Following that policy prescription, a number of cities (such as Dallas-Fort Worth, Kansas City and others) have achieved the objective of putting people over place. For most of society, middle-income households as well as lower income households, the best cities are where governments have overseen local housing markets competently, evidenced by housing that is affordable, all else equal. In such cities, the cost of living tends to be lower, as households are able to afford a more affluent life.
Oliver Hartwich, of the New Zealand Initiative notes in his introduction, “We should not accept extreme price levels in our housing markets. High house prices are not a sign of city’s success but a sign of failure to deliver the housing that its citizens need.”
Wendell Cox is principal of Demographia, an international public policy and demographics firm. He is a Senior Fellow of the Center for Opportunity Urbanism (US), Senior Fellow for Housing Affordability and Municipal Policy for the Frontier Centre for Public Policy (Canada), and a member of the Board of Advisors of the Center for Demographics and Policy at Chapman University (California). He is co-author of the “Demographia International Housing Affordability Survey” and author of “Demographia World Urban Areas” and “War on the Dream: How Anti-Sprawl Policy Threatens the Quality of Life.” He was appointed to three terms on the Los Angeles County Transportation Commission, where he served with the leading city and county leadership as the only non-elected member. He served as a visiting professor at the Conservatoire National des Arts et Metiers, a national university in Paris.
Photograph: Rochester, New York: Most Affordable Major Housing Market in 2016 by Theresa Marconi (Personal Communication) [CC BY-SA 3.0], via Wikimedia Commons

