2010-2013 Small Area Data Shows Strong Suburban & Exurban Growth
The latest small area estimates from the Census Bureau indicate that suburban and exurban areas continue to receive the overwhelming share of growth in metropolitan areas around the country, with a single exception, New York. The new American Community Survey (Note 1) 5 year file provides an update of data at the ZCTA (zip code tabulation area), which are described below, as analyzed by the City Sector Model. The data was collected from 2011 through 2015, and can therefore be considered generally reflective of the middle year of the period, 2013.
City Sector Model Analysis
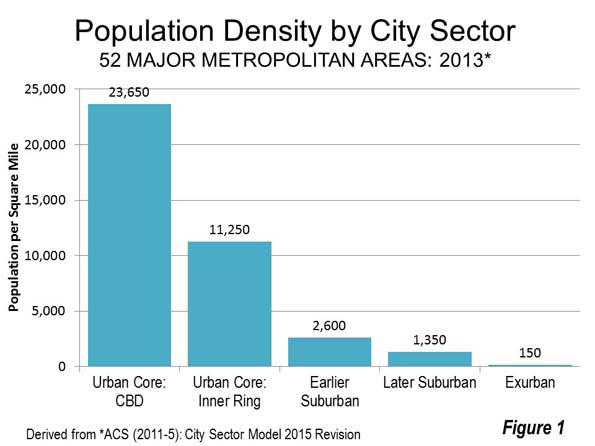
The City Sector Model classifies small areas into five categories based on population density, commuting mode and age of development (the criteria is described in Figure 7). There are two pre-World War II classifications, the Urban Core CBD (central business district) and the Urban Core Inner Ring. These areas are typified by substantial reliance on transit, walking and cycling for commuting and have higher population densities. There are also three post-World War II, classifications, the Early Suburbs, Later Suburbs and the Exurbs, both of which have lower population densities and substantial automobile orientation (Figure 1).
The Overall Demographic Trends
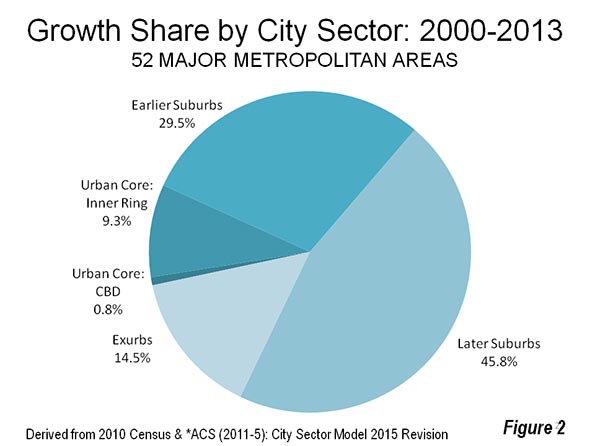
In contrast to the narrative that there has been a “return to the cities” (meaning the urban core, as opposed to cities in the functional sense or physical sense, which are metropolitan areas and urban areas respectively see Note 2 in a previous post), most new residents are located in the suburbs and exurbs. Between 2010 and 2013, The automobile oriented suburbs and exurbs captured 89.9 percent of the new population growth in 52 major metropolitan areas (over 1,000,000 population in 2013). By contrast, 10.1 percent of major metropolitan population growth was in the Urban Core. The Urban Core-CBD, (largely identified with the Central Business District), accounted for 0.8 percent of the growth, and the Urban Core: Ring, the neighborhoods surrounding the core, for the other 9.3 percent (Figure 2). Although the vast majority of growth is concentrated in the suburbs and exurbs, the urban core has reversed their long-term decline, after suffering a small loss in population between 2000 and 2010.
Each of the five categories experienced population increases between 2010 and 2015 (Figure 3). However, only the Later Suburbs grew faster than its pre-existing share of the metropolitan population. The Later Suburbs had 26.9 percent of the population in 2010, yet added a much stronger 45.8 percent of the population increase from 2010 to 2013.
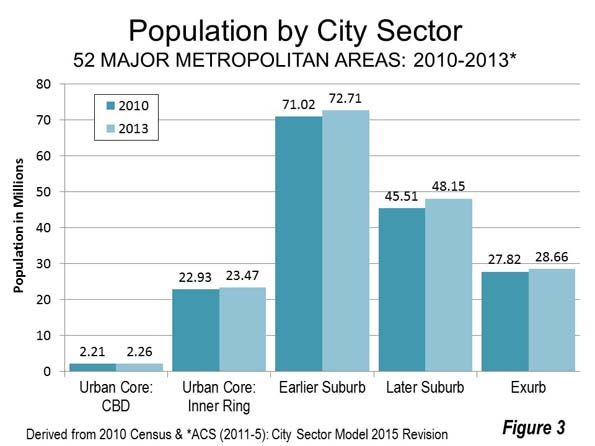
The Earlier Suburbs grew faster than in the previous decade, but their 29.5 percent share of metropolitan growth was far less than their 41.5 percent population share in 2010. The Urban Core: CBD captured 0.8 percent of the growth, less than its prior 1.3 percent share, while the Urban Core: Inner Ring fell nearly one-third short of equaling its previous population share. The Exurbs, which were hit hard by the Great Recession, also fell short of gaining at the rate of their population (Figure 4).

New York and the Rest
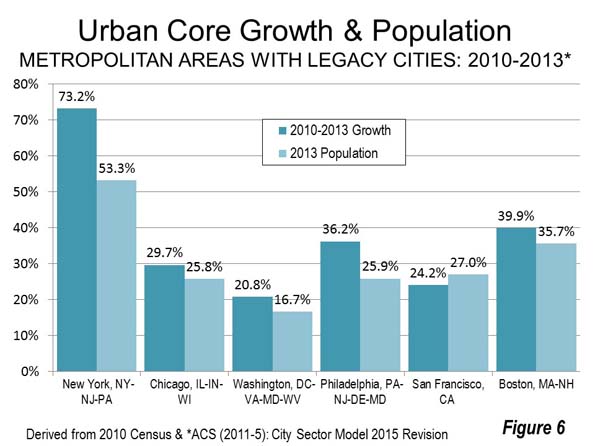
The New York metropolitan area, dominated the nation in urban core growth, with 73.2 percent of the population increase, leaving only 27.8 percent for the suburbs. Even this, however, is not likely an indication of a “return to the core city” because of apparent net domestic migration losses (Note 2) throughout the metropolitan area. In fact the city of New York was not attracting new domestic migrants at all, from the suburbs or elsewhere in the nation, with a net domestic migration loss of 400,000 between 2010 and 2015. All of the city of New York’s population gain was due to an excess of births over deaths and, as befits one of the world’s great global cities, international migration.
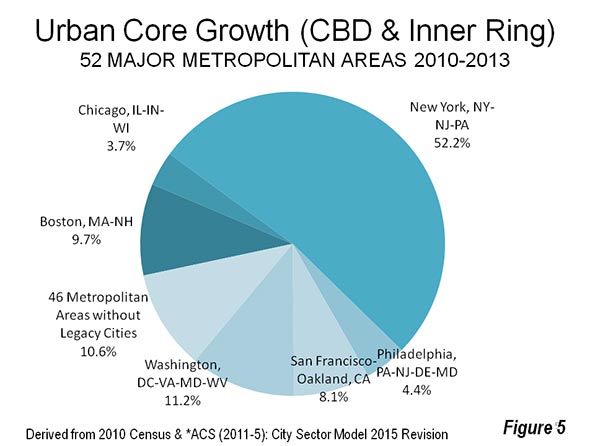
New York’s domination of urban core growth was astounding in raw numbers, as well. More than one-half of all the urban core growth among the major metropolitan areas was in the New York metropolitan area. Washington was a distant second, with 11.2 percent of the urban core growth. Boston was close behind at 9.7 percent, followed by San Francisco-Oakland at 8.1 percent. The other two metropolitan areas with legacy core cities were substantially lower, with Philadelphia accounting for 4.1 percent and Chicago 3.7 percent. All of the 46 metropolitan areas without legacy core cities, accounted for only 10.6 percent of total urban core growth, one-fifth the growth in New York alone. As with so much, the story of high density urban cores in the United States is largely about New York (Figure 5).
Nothing like New York’s domination of urban core growth over suburban and exurban growth occurred elsewhere, not even among the other five metropolitan areas with “legacy cities” (core cities). These are the metropolitan areas with the six largest central business district in the United States, and in which the core cities account for 55 percent of the national transit commuting destinations (despite having only six percent of the national employment).
Boston, came the closest, with 39.9 percent of its growth in the urban core. There was one other metropolitan area with more than 30 percent of its growth in the urban core, Philadelphia at 36.2 percent. The Chicago urban core accounted for 29.7 percent of its growth, San Francisco for 24.5 percent and Washington for 20.8 percent. Each of these, with the exception of San Francisco, managed to have proportionally greater growth in its urban core than the population share already living there (Figure 6).
The situation was much different in the 46 major metropolitan areas without legacy core cities. In these, nearly all population growth (98.6 percent) was in the suburbs and exurbs. This is slightly above the 94.5 percent of the population living there.
Suburban Nation
Using a different small area classification system, the Urban Land Institute (ULI) has reached similar conclusions on the distribution of metropolitan population and growth. Indicating that “America remains a largely suburban nation,” ULI indicates that 79 percent of the nation’s metropolitan population lives in the suburbs and that suburban areas accounted for 91 percent of metropolitan growth from 2000 to 2015. These trends are mirrored in large measure in Canada and Australia, according to work led by Professor David Gordon of Queens University in Kingston, Ontario.
To be sure, the improvement in urban core fortunes is a very positive development. There is no question that urban cores are far nicer places than they were two decades ago and that their renewed growth makes the entire city, from the central business district to the sparsely populated exurbs, a better and more productive place. But the bulk of growth, and the preponderance of the population, remains firmly suburban.
Note 1: The American Community Survey (ACS) uses sampling methods from which estimates are built, not actual counts like occur in the US Census every 10 years. The most reliable data is from the Census, which will be conducted next in 2020.
Note 2: “Apparent” is used because domestic migration data is not reported below the county level (such as in ZCTA’s). However, much of the Urban Core is in the city of New York and all of the inner ring suburban counties lost domestic migrants, suggesting that net domestic migration gains could not have occurred.
Wendell Cox is principal of Demographia, an international public policy and demographics firm. He is a Senior Fellow of the Center for Opportunity Urbanism (US), Senior Fellow for Housing Affordability and Municipal Policy for the Frontier Centre for Public Policy (Canada), and a member of the Board of Advisors of the Center for Demographics and Policy at Chapman University (California). He is co-author of the “Demographia International Housing Affordability Survey” and author of “Demographia World Urban Areas” and “War on the Dream: How Anti-Sprawl Policy Threatens the Quality of Life.” He was appointed to three terms on the Los Angeles County Transportation Commission, where he served with the leading city and county leadership as the only non-elected member. He served as a visiting professor at the Conservatoire National des Arts et Metiers, a national university in Paris.
