Urban Containment, Endangered Working Families and Beleaguered Minorities
 Working families and the middle class are becoming an increasingly endangered species in many parts of United States. Median household income remains below its 1999 peak (inflation adjusted). But the problem is not just stagnant incomes. Expenses are also rising, especially the costs of housing in some cities. As a result, it is becoming more and more difficult to make ends meet.
Much of this has to do, as explained below, with attempts to stop development on the urban periphery which is indispensable to keeping housing affordable. Such prohibitions have been widely advocated by the planning establishment. Moreover, a new White House Housing Development Toolkit, rightly identifies housing unaffordability as an important issue but does not mention the important role of greenfield development in keeping costs down.
Housing Affordability Problem
Housing costs are generally responsible for the difference in cost of living between US cities (metropolitan areas). The range between cities in the Bureau of Economic Analysis (BEA) cost of living index (Regional Price Parities) in housing cost is far greater than that of its other two elements — 13 times goods and eight times services other than rents. It is no wonder that households are moving to affordable markets.
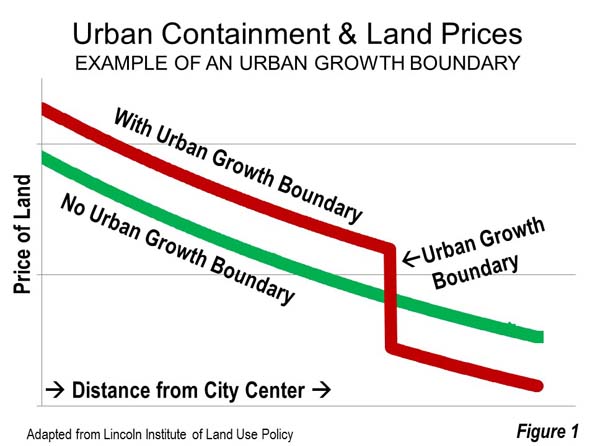
Excessive land use regulation is a major cause of seriously unaffordable housing. Usually, these regulations include urban containment policy, which restricts or even prohibits building middle income detached housing on the urban fringe. As sure as OPEC cutbacks drive up the price of gasoline, urban planning land cutbacks drive up house prices. There is plenty of evidence that the law of supply and demand operates in urban land markets — that restricting the availability of land for development pushes land (Figure 1) and house prices up (See: A Question of Values: Middle-Income Housing Affordability).
By definition, housing affordability must be measured in relation to incomes. It should also be compared to trends over time both within the metropolitan area (housing market) and betweenmetropolitan areas (See Canada’s Middle-Income Housing Affordability Crisis).
The most acute problem is in California, where house prices are up to four times those in liberally regulated US metropolitan areas. Before excessive land use regulations were imposed, housing affordability in California, prices relative to incomes, were similar to the rest of the nation, rarely exceeding 3.0 (measured by the “median multiple,” the median house price divided by the median household income).
There is little comprehension of the seriousness of the housing affordability problem. With serious concerns being raised about income inequality, housing affordability represents one of the most important threats both to the well-being of middle-income households and poverty reduction. More than anywhere in the country, the price of middle income housing is beyond the reach of most middle income California households, including those who would easily qualify in liberally regulated markets.
At the same time, middle-income households in other excessively regulated markets, like Seattle, Portland, Denver, Miami, Boston and New York have seen their house prices double (or more) as regulations have been stiffened. Finally, all of this increases the demand for subsidized housing. While there is plenty of rhetoric about affordable housing for lower income households, there is not and there is not likely to ever be enough money.
The key issue is the cost of residential land under the house. Average residential land values are at least 75 percent of the house and land value in San Jose and San Francisco (Note 1), 70 percent in Los Angeles and 65 percent in San Diego. Our analysis of Lincoln Institute of Land Policy data indicates that the average house structure in the four California metropolitan areas had an average value is only 25 percent higher than that of the other major metropolitan areas. By contrast, the land value was more than 650 percent higher. It would be too expensive for middle income households to buy vacant residential lots, even if they intended living in tents.
With such expensive land, there is virtually no hope to restore housing affordability without tackling the issue of land head on. In the meantime, house prices weigh heavily on all households, and many are leaving California, particularly in their mid-thirties and above.
Lower Income Minorities: African Americans and Hispanics
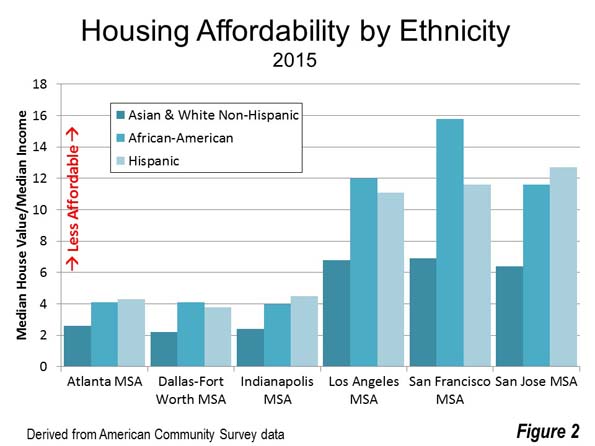
The situation for housing is far worse for ethnic groups with lower incomes. The maximum housing affordability disadvantage faced by African Americans and Hispanics is illustrated in the following examples. In the San Francisco MSA, the median value house would cost the equivalent of 9 more years of median African-American income than for Asian or White-Non-Hispanics. This has escalated from 1.3 years before regulations were strengthened. An Hispanic household would need six more years of median income to pay for the median valued house in the San Jose MSA. There also large spreads, both for African-American and Hispanic households in other highly regulated metropolitan areas, such as Los Angeles, San Diego, Portland, Boston and New York (See Figure 2 and Table: Housing Affordability: Overall and by Ethnicity).
Planning’s “Killer App”
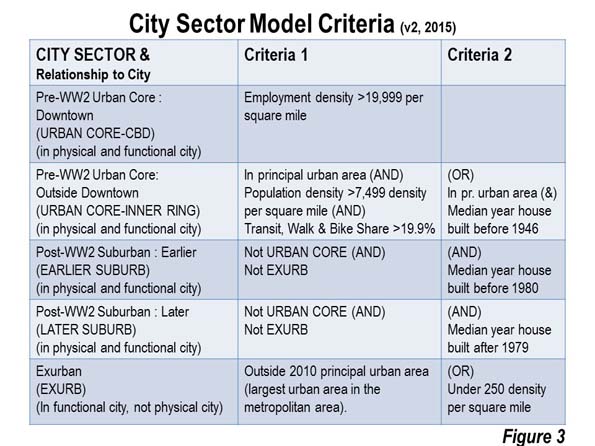
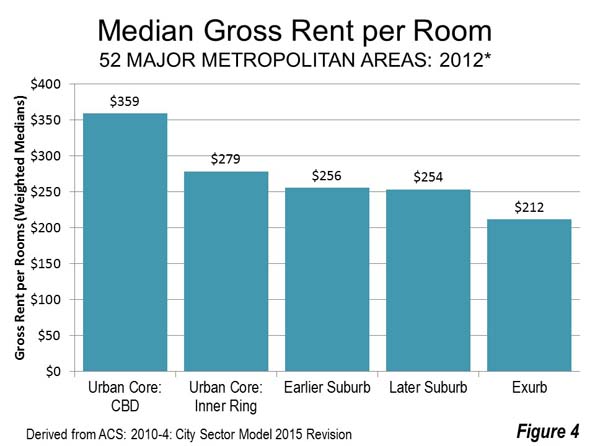
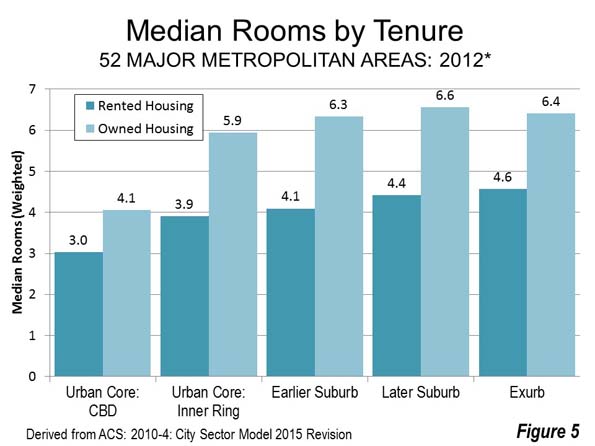
It is popular to contend that housing affordability can be restored through building higher densities. There are no examples of restoring metropolitan area housing affordability through intensification. A principal problem is higher prices. A City Sector Model (Figure 3) analysis indicates that the urban core rents per room are well above that of the suburbs (Figure 4). The differences are even greater in cities with the more aggressive intensification programs, such as Portland, Seattle and Los Angeles (Note 3). Housing units are also smaller (Figure 5). “Granny flats,” basements and apartments are too small for many middle-income households. Forced intensification impairs the quality of life for many people, particularly families (Note 4)
These policies also have the effect of widening economic divisions. Matthew Rognlie of the Massachusetts Institute of Technology examined French economist Thomas Piketty’s research on rising inequality and concluded that much of the observed inequality stems from housing. He went on to suggest re-examining the land use regulations that create scarcity, toward the end of increasing housing supply. My colleague Hugh Pavletich, co-author of Demographia International Housing Affordability Survey argues that without the “safety valve” of greenfield development, because housing cannot be kept affordable since urban containment destroys the competitive market for land.
New Zealand consultant Phil Hayward observes: “There might be other policy mixes by which housing supply within a growth boundary could be made the means of keeping housing affordable, but publicly and politically, the debate is nowhere near tackling the complexities involved” (See The Myth of Affordable Intensification).
Further, large lot or rural zoning is frequently cited as an impediment to housing affordability. This is consistent with economic theory, but its influence is miniscule compared to urban containment (Note 5). The metropolitan areas with substantial large lot zoning had an average price-to-income ratio of 3.0 in 2014, at the upper bound of affordability. This is in contrast with the seriously unaffordable price-to-income ratios (from 5.1 to 9.7) that have urban containment policy . The highest price-to-income ratios are in California’s large metropolitan areas, where there are smaller lot sizes.
Based on the unparalleled damage they do to housing affordability, urban containment boundaries may be planning’s “killer app.” A principal objective of urban containment policy is to curb the outward expansion of cities (“urban sprawl”). But the “medicine” is far worse than the “cure” — lower standards of living and greater poverty, inflicting particular harm to lower income minorities.
Necessary Reforms
Unfortunately, housing affordability has not become an issue in this election year. Yet, policy reforms are appropriate:
- Urban containment policy should not be implemented where it has not been adopted.
- In urban containment metropolitan areas, improved housing affordability targets should be adopted (price to income ratios), with “event triggered” liberalization of urban fringe land use if the targets are not met. Similar reforms have been proposed in New Zealand and by Paul C. Cheshire, Max Nathan and Henry G. Overman of the London School of Economics.
| Housing Affordability: Overall and By Ethnicity | |||||||
| Major Metropolitan Areas | |||||||
| Median Multiple (Years of Median Income Needed to Buy the Median Priced House) | |||||||
| Additional Years Requried | |||||||
| All | Asians and White Non-Hispanics | African Americans | Hispanic | African Americans | Hispanic | ||
| United States | 3.5 | 3.1 | 5.3 | 4.3 | 2.2 | 1.2 | |
| Atlanta, GA | 3.1 | 2.6 | 4.1 | 4.3 | 1.5 | 1.8 | |
| Austin, TX | 3.6 | 3.0 | 4.9 | 5.0 | 1.9 | 2.0 | |
| Baltimore, MD | 4.0 | 3.4 | 5.7 | 4.3 | 2.3 | 1.0 | |
| Birmingham, AL | 3.0 | 2.6 | 4.6 | 3.8 | 2.0 | 1.2 | |
| Boston, MA-NH | 5.0 | 4.5 | 9.3 | 9.2 | 4.8 | 4.7 | |
| Buffalo, NY | 2.6 | 2.3 | 5.1 | 5.3 | 2.8 | 3.0 | |
| Charlotte, NC-SC | 3.2 | 2.7 | 4.8 | 4.3 | 2.1 | 1.5 | |
| Chicago, IL-IN-WI | 3.6 | 2.9 | 6.4 | 4.5 | 3.5 | 1.6 | |
| Cincinnati, OH-KY-IN | 2.8 | 2.6 | 5.3 | 3.7 | 2.8 | 1.2 | |
| Cleveland, OH | 2.8 | 2.4 | 4.9 | 3.9 | 2.5 | 1.5 | |
| Columbus, OH | 2.9 | 2.6 | 4.6 | 3.7 | 2.0 | 1.1 | |
| Dallas-Fort Worth, TX | 2.8 | 2.2 | 4.1 | 3.8 | 1.8 | 1.5 | |
| Denver, CO | 4.5 | 4.0 | 7.4 | 6.3 | 3.3 | 2.3 | |
| Detroit, MI | 2.8 | 2.4 | 4.7 | 3.6 | 2.3 | 1.2 | |
| Grand Rapids, MI | 2.7 | 2.6 | 5.2 | 3.7 | 2.7 | 1.1 | |
| Hartford, CT | 3.4 | 3.0 | 5.4 | 6.5 | 2.4 | 3.6 | |
| Houston, TX | 2.7 | 2.0 | 4.0 | 3.6 | 2.0 | 1.6 | |
| Indianapolis. IN | 2.7 | 2.4 | 4.5 | 4.0 | 2.1 | 1.6 | |
| Jacksonville, FL | 3.2 | 2.9 | 4.8 | 3.7 | 2.0 | 0.9 | |
| Kansas City, MO-KS | 2.7 | 2.5 | 4.5 | 3.7 | 2.0 | 1.2 | |
| Las Vegas, NV | 4.2 | 3.7 | 6.0 | 4.9 | 2.3 | 1.2 | |
| Los Angeles, CA | 8.6 | 6.8 | 12.0 | 11.1 | 5.2 | 4.2 | |
| Louisville, KY-IN | 2.9 | 2.7 | 4.9 | 3.4 | 2.3 | 0.7 | |
| Memphis, TN-MS-AR | 2.9 | 2.1 | 4.1 | 3.5 | 2.0 | 1.4 | |
| Miami, FL | 4.8 | 3.8 | 6.2 | 5.5 | 2.4 | 1.8 | |
| Milwaukee,WI | 3.5 | 3.0 | 6.9 | 5.0 | 3.9 | 2.0 | |
| Minneapolis-St. Paul, MN-WI | 3.3 | 3.0 | 7.3 | 5.1 | 4.3 | 2.1 | |
| Nashville, TN | 3.3 | 3.0 | 5.2 | 4.2 | 2.2 | 1.2 | |
| New Orleans. LA | 3.9 | 3.1 | 6.0 | 4.5 | 3.0 | 1.5 | |
| New York, NY-NJ-PA | 6.0 | 4.8 | 8.8 | 9.2 | 4.0 | 4.4 | |
| Oklahoma City, OK | 2.8 | 2.5 | 4.5 | 3.4 | 2.0 | 0.9 | |
| Orlando, FL | 3.4 | 2.9 | 4.4 | 4.3 | 1.5 | 1.4 | |
| Philadelphia, PA-NJ-DE-MD | 3.7 | 3.1 | 6.2 | 5.8 | 3.1 | 2.8 | |
| Phoenix, AZ | 3.9 | 3.5 | 5.4 | 5.2 | 1.9 | 1.7 | |
| Pittsburgh, PA | 2.6 | 2.5 | 5.4 | 3.4 | 2.9 | 0.9 | |
| Portland, OR-WA | 4.7 | 4.5 | 8.7 | 6.0 | 4.2 | 1.5 | |
| Providence, RI-MA | 4.3 | 4.0 | 6.7 | 7.6 | 2.7 | 3.7 | |
| Raleigh, NC | 3.4 | 2.9 | 5.1 | 5.7 | 2.1 | 2.7 | |
| Richmond, VA | 3.6 | 3.0 | 5.4 | 4.1 | 2.4 | 1.1 | |
| Riverside-San Bernardino, CA | 5.3 | 4.7 | 6.6 | 6.0 | 1.8 | 1.3 | |
| Rochester, NY | 2.6 | 2.3 | 4.6 | 4.5 | 2.3 | 2.2 | |
| Sacramento, CA | 5.4 | 4.9 | 8.4 | 6.8 | 3.6 | 1.9 | |
| St. Louis,, MO-IL | 2.9 | 2.6 | 4.9 | 3.5 | 2.3 | 0.9 | |
| Salt Lake City, UT | 3.8 | 3.6 | 6.2 | 5.3 | 2.6 | 1.7 | |
| San Antonio, TX | 2.7 | 2.2 | 3.1 | 3.3 | 0.9 | 1.1 | |
| San Diego, CA | 7.2 | 6.2 | 9.3 | 9.5 | 3.1 | 3.3 | |
| San Francisco, CA | 8.1 | 6.9 | 15.8 | 11.6 | 8.8 | 4.7 | |
| San Jose, CA | 8.1 | 6.9 | 11.6 | 12.7 | 4.7 | 5.8 | |
| Seattle, WA | 4.8 | 4.4 | 7.8 | 7.0 | 3.4 | 2.6 | |
| Tampa-St. Petersburg, FL | 3.4 | 3.2 | 4.7 | 4.0 | 1.5 | 0.8 | |
| Tucson, AZ | 3.5 | 3.1 | 5.0 | 4.2 | 1.8 | 1.1 | |
| Virginia Beach-Norfolk, VA-NC | 3.9 | 3.4 | 5.7 | 4.7 | 2.3 | 1.3 | |
| Washington, DC-VA-MD-WV | 4.3 | 3.6 | 5.9 | 5.8 | 2.3 | 2.2 | |
| Data from American Community Survey: 2015 | |||||||
| AFFORDABILITY RATINGS | |||||||
| Affordable | 3.0 or below | ||||||
| Moderately Unaffordable | 3.1 to 4.0 | ||||||
| Seriously Unaffordable | 4.1 to 5.0 | ||||||
| Severely Unaffordable | 5.1 and over | ||||||
Note 1: Commentators sometimes suggest the high housing prices in the San Francisco Bay Area are the result of land shortages created by topographic constraints, such as bodies of water and mountains. In fact, there is plenty of developable land in the Bay Area, which includes both the San Francisco and San Jose MSAs (See: The Incompatibility of Forced Densification and Housing Affordability).
Note 2: This is without considering subsidies and tax breaks that can reduce some rents below market levels.
Note 3: African American 1969 median household is estimated based on the variation in African American median family income from the overall median in that year. Median household income data was not published for ethnicities in the 1970 census.
Note 4: The planning establishment sometimes glosses over the reduced quality of life entailed in its efforts to discourage detached housing and force people into higher density housing. This is not their job. The quality of life can only be judged by households themselves.
Note 5: Boston is an exception, which is the only seriously unaffordable major metropolitan area without urban containment policy. Boston has large lot zoning so expansive that it has created a severe shortage of land for development, with urban containment-like effects on house prices. Boston’s urbanization covers nearly as much land area as the Tokyo urban area, despite having only one-seventh the population. (See: The Evolving Urban Form: Sprawling Boston).
Photo: Market Street, San Francisco, looking toward the Ferry Building (by author)
Wendell Cox is principal of Demographia, an international pubilc policy and demographics firm. He is a Senior Fellow of the Center for Opportunity Urbanism (US), Senior Fellow for Housing Affordability and Municipal Policy for the Frontier Centre for Public Policy (Canada), and a member of the Board of Advisors of the Center for Demographics and Policy at Chapman University (California). He is co-author of the “Demographia International Housing Affordability Survey” and author of “Demographia World Urban Areas” and “War on the Dream: How Anti-Sprawl Policy Threatens the Quality of Life.” He was appointed to three terms on the Los Angeles County Transportation Commission, where he served with the leading city and county leadership as the only non-elected member. He served as a visiting professor at the Conservatoire National des Arts et Metiers, a national university in Paris.
This article was originally published by New Geography on 10/4/2016

