The Houses Americans Choose to Buy

By Wendell Cox
The US preference for detached housing remains strong, according to the newest data just released in the 2014 American Community Survey, by the United States Census Bureau. In 2014, detached house and represented 82.4 percent of owned housing in the United States. This is up 1.8 percentage points from the 80.6 percent registered in the 2000 census. The increase may be surprising, given the efforts of planners to steer people into higher density housing, especially apartments.
The US Situation in 2014
Among owned housing, mobile homes rank second only to detached housing. Attached houses, which are ground-oriented units with common walls, such as townhomes and semi-detached homes (also called duplexes) are the third most popular form of owned housing, accounting for 5.7 percent of units in 2014. Perhaps surprisingly, the apartment planners prefer ranked fourth preference among households buying their own homes. Apartments, which include lower rise, midrise, and high-rise condominiums account for 5.5 percent of owned housing.
Speaking of condos, if you are looking to protect your condo in California for example, it may be worth doing some research beforehand, as this is an important part of owning a place of your own. Plus, it is always best to be safe than sorry, as you just never know what could happen. However, that being said, it is important to remember that condominium insurance is different from regular home insurance. For instance, when you buy a condo, although you do not actually own the building or the land your condo sits on, you do own everything on the inside of the condo including the internal walls. This is where condominium insurance comes into play. Ultimately, because you are not renting the unit, and you do not own the building, you need coverage for your personal property and therefore, a condo insurance policy is going to help protect the interior of your home. Above all, if you live in a condominium, it is in your best interest to have peace of mind by getting covered.
The fifth, and by far the smallest category of owned housing is “Boats, RVs, Vans, Etc., which represented 0.1 percent of owned housing.

Trend Since 2000
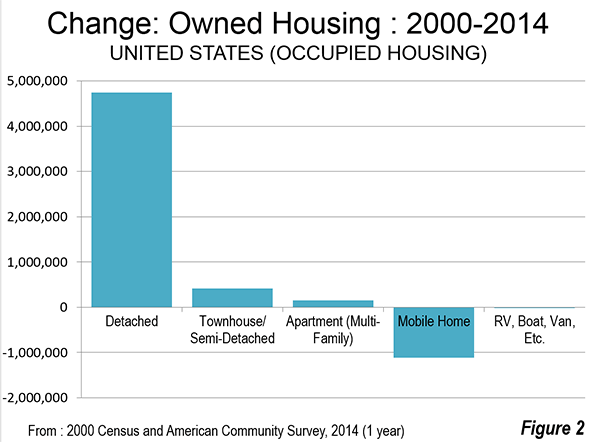
There were approximately 4.7 million more detached houses in 2014 than in 2000. This means that 114 percent of the new owned housing stock was detached housing. Despite their second-ranking among housing types, there were substantial losses in the number of mobile homes. In 2014 there were approximately 1.1 million fewer mobile homes and continuing losses could drop mobile homes below attached homes and apartments over the next decade. Mobile homes are often transitional for households aspiring to afford detached or even attached housing. Attached homes enjoyed a strong increase of approximately 410,000 units. The strong detached and attached housing increase could reflect, in part, the realization of those aspirations.
Apartments, which were within 15,000 of attached houses in 2000, dropped to approximately 270,000 behind, while adding only 160,000 owned units. In view of the strong condominium construction rates in some cities, this may be surprising. On the other hand, it could be indicative of the “dark and empty” thesis that many of the new units have been purchased for only occasional use and not as primary residences, some rented out by owners (Figure 2).
There was an 18,000 unit loss in “Boats, RVs, Vans, Etc.”
Owned Housing by Metropolitan Classification
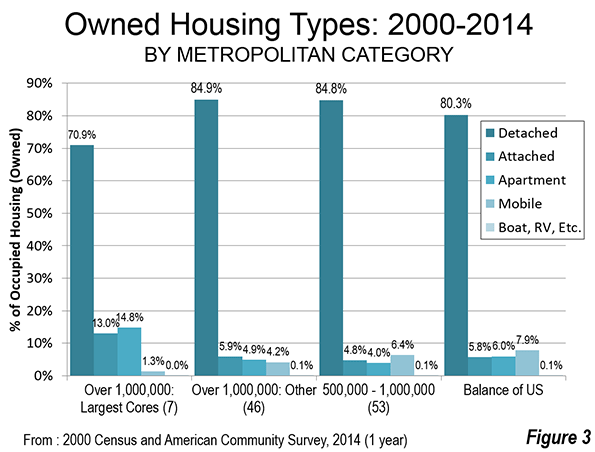
The preference for detached housing was pervasive, even in the metropolitan areas with the largest pre-World War II urban cores (identified using the City Sector Model). Nearly 71 percent of owned housing is detached in these metropolitan areas, which include New York, Los Angeles, Chicago, Philadelphia, Washington, Boston and San Francisco. The detached housing percentage rises to 85 percent in the other 46 metropolitan areas with more than 1 million population and is similar for the 53 metropolitan areas between 500,000 and 1 million population. Among the 106 metropolitan areas with more than 500,000 population, the percentage of detached housing increased in 86.
The detached housing share is a smaller 80 percent outside these largest metropolitan areas.
The defining difference between the metropolitan areas with the largest cores is in owned apartments, which represent 15 percent of owned housing. This is more than three times the rate of owned apartments in the other 46 major metropolitan areas and the 53 metropolitan areas with between 500,000 and 1,000,000 population (Figure 3).
Housing Types by Metropolitan Areas
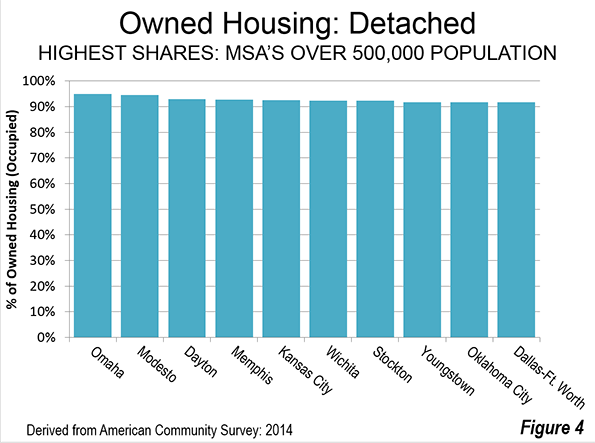
Among the 106 metropolitan areas, 86 have detached percentages of owned housing of 80 percent or more. The highest detached housing percentage is in Omaha, at 94.8 percent. Modesto trails closely at 94.4 percent. This may not be surprising, since so many households have been driven away from close enough-for-a-long-commute San Francisco Bay Area by its exorbitant house prices and severely constrained housing choices. Detached housing is now a luxury in the Bay Area well beyond the resources of middle income households who did not buy their homes in the past, when prices were lower.
The gap between second and third is much larger, with Dayton having a detached housing percentage of 92.8 percent, followed closely by Kansas City (92.7 percent), Memphis (92.6 percent) and Wichita (92.4 percent). Stockton, at 92.3 percent has attracted so many San Francisco Bay Area residents that it is now a part of the San Francisco Bay combined statistical area ranks eighth, (Figure 4).
The lowest rates of detached owned housing are in Miami (63.8 percent), Philadelphia (63.9 percent), New York (65.4 percent), Baltimore (65.4 percent), and Honolulu (66.0 percent).
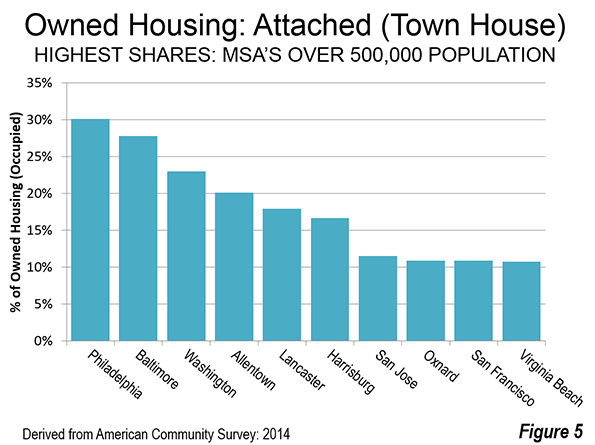
Philadelphia and Baltimore compensate substantially for their low detached housing percentage by leading in attached housing, which is widely dispersed in both the core municipalities and the suburbs. More than 30 percent of Philadelphia’s owned housing is attached, and 27 percent of Baltimore’s. In Washington and Allentown more than 20 percent of owned housing is also attached (Figure 5).
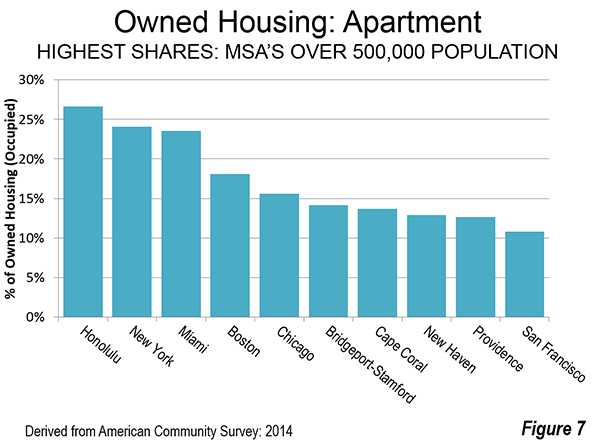
Honolulu has the largest percentage of owned apartment housing, at 26.6 percent. New York (24.1 percent) and Miami (23.6 percent) follow. Only two other metropolitan areas, have more than 15 percent of their owned housing in apartments, Boston and Chicago (Figure 6).
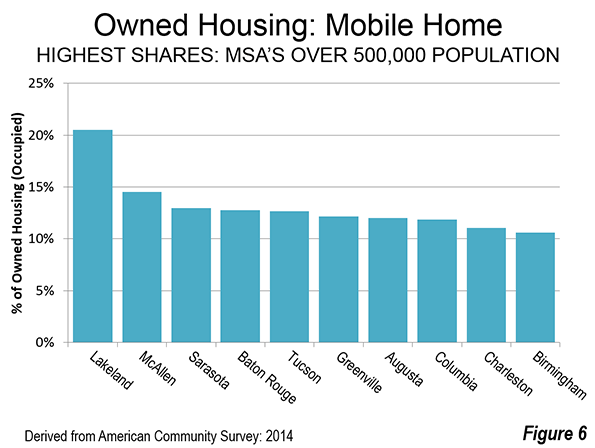
All of the metropolitan areas with the 10 highest percentages of mobile homes are in the South, with the exception of Tucson. Lakeland, Florida has by far the largest mobile on percentage, and over 20 percent. McAllen, Sarasota, Baton Rouge and Tucson complete the top five, ranging from 12.6 percent to 14.5 percent (Figure 7).
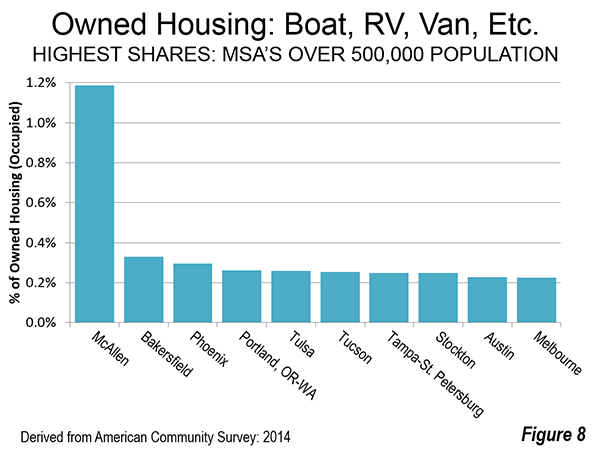
As noted above, the percentages of owned housing in the “Boats, RVs, Vans, Etc.” category are much smaller. McAllen has the largest share at 1.2 percent. The top 5 is rounded out by Bakersfield, Phoenix, Portland (OR-WA) and Tucson (Figure 8).
The Detached House: Still King
Three decades ago, historian Robert Fishman wrote: “For the first time in any society, the single-family detached house was brought within the economic grasp of the majority of households” (Note). The US may have been first, but it is not alone. The same observation can be made for other nations, such as Japan, Canada, Australia, New Zealand and Norway. The detached house is alive and well in the United States and may even be increasing its domination.
Note: This quotation is from Fishman’s “Bourgeois Utopias: The Rise and Fall of Suburbia” (page 183). The subtitle should not be interpreted to suggest that this is another superficial anti-suburban screed. In fact, Fishman’s point can be interpreted as indicating that suburbia has been replaced by a new type of city, even less connected with the former dominant (monocentric) core.
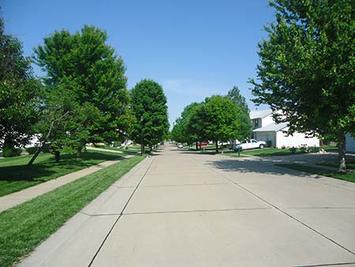
Photo: Minneapolis-St. Paul suburbs (author)
Wendell Cox is Chair, Housing Affordability and Municipal Policy for the Frontier Centre for Public Policy (Canada), is a Senior Fellow of the Center for Opportunity Urbanism (US), a member of the Board of Advisors of the Center for Demographics and Policy at Chapman University (California) and principal of Demographia, an international public policy and demographics firm.He is co-author of the “Demographia International Housing Affordability Survey” and author of “Demographia World Urban Areas” and “War on the Dream: How Anti-Sprawl Policy Threatens the Quality of Life.” He was appointed to three terms on the Los Angeles County Transportation Commission, where he served with the leading city and county leadership as the only non-elected member. He served as a visiting professor at the Conservatoire National des Arts et Metiers, a national university in Paris.
This article was originally published by newgeography.com on 10/27/2015


