URBAN CORE MILLENNIALS? A MATTER OF PERSPECTIVE
by Wendell Cox 03/06/2015
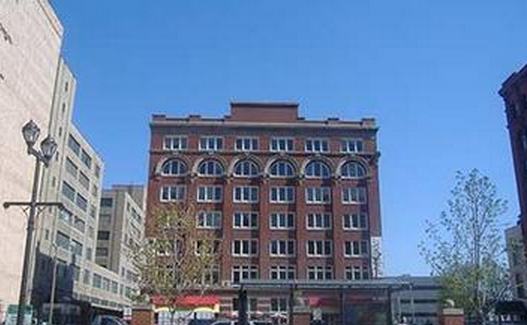
The revitalizing CBD of St. Louis (by author)
Yes, millennials are moving to the urban cores but not in significant numbers when view from the context of larger city (metropolitan area) trends. That’s the updated story, based on new small area data that approximates the year 2011 (Note: ACS 5-Year Data).
Small area trends are important to understanding developments in metropolitan areas, because conventional municipal jurisdiction based analysis obscures the extent of large suburban areas within the boundaries of most core municipalities. In 2010, approximately 58% of the population in core municipalities lived in small areas that were essentially suburban, with much lower population densities than areas that developed before World War II, and where nearly all motorized travel is by car.
Even worse, “principal cities,” have been equated to core municipalities in some analyses, despite their overwhelming suburban, single family nature, such as Staten Island in New York to the broad expanses of Phoenix, Denver, and Portland. Excepting the core municipalities, the principal cities designated since 2000 are polycentric business centers, the metropolitan area criteria adopted by the Office of Management and Budget (OMB). Marking the transition of American cities from being monocentric to polycentric, principal cities are 92% suburban and exurban.
This analysis uses my City Sector Model, which classifies small areas (ZIP codes, more formally, ZIP Code Tabulation Areas, or ZCTAs) in metropolitan areas in the nation based upon their function as urban cores, suburbs, or exurbs. The criteria used are generally employment and population densities and the extent of transit use versus car use. The purpose of the urban core sectors is to replicate, to the best extent possible, the urban form as it existed before World War II, when urban densities were much higher and a far larger percentage of urban travel was on transit. The suburban and exurban sectors replicate automobile-oriented suburbanization that began in the 1920s and escalated strongly following World War II.
A recent revision to the model divided the urban core into two classifications, the downtown or central business district (“CBD”) and the “inner ring.” The CBD is the locus of the most important urban revitalization in the core municipalities, while the inner ring includes the remaining part of the urban core that resembles the outlying parts of the pre-World War II city in its travel patterns and population densities (the City Sector Model criteria are described in the note below).
The Anecdotal Evidence
Seemingly endless stories are covered in both the print and electronic media describing how younger adults have been attracted to the urban core. Press organs like The New York Times and the Los Angeles Times can readily send their reporters to nearby cafes, bars, and restaurants. Much rarer are the anecdotes from the suburban strip malls and even a “Starbucks” on Long Island, Sugarland, outside Houston, or in the San Fernando Valley. But data, not anecdotes, are the most reliable indicators of actual trends.
From Anecdotes to Data
The new data reinforces the reality that the story of millennials in the urban core is more nuanced than often suggested. This analysis compares population data for younger adults in the age range of 20 to 29 years old.
Data: The Urban Core
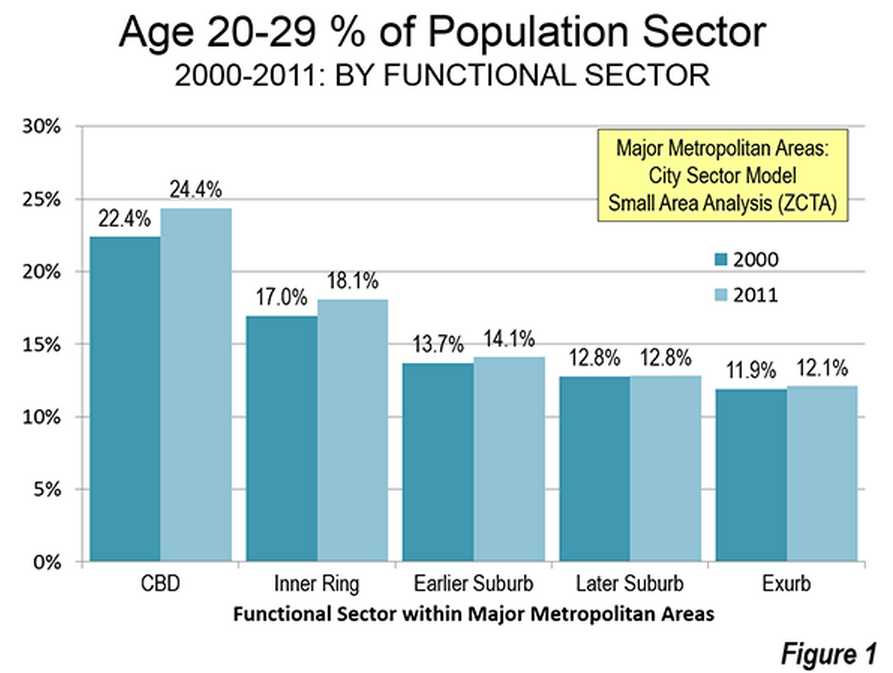
The “good news” relates to part of the city, the urban core. Millennials are concentrating to a greater degree than before in the urban core. Millennials have a larger share of the total population in the CBD then in any of the other for city sectors. In 2011, millennials represented 24.4% of the CBD population. By comparison, millennials are a much smaller 14.1% of the overall metropolitan population and the share in the exurbs is only 12.1%, less than one half that in the CBD. The associated inner ring has the second highest millennial component, at 18.1%, well above the shares in the outer sectors. Further, the millennial composition of the CBD increased between 2000 and 2011 from 22.4% to 24.4%. The inner ring millennial composition also increased, from 17.0% to 18.1% (Figure 1).
So there is no question that the urban core millennial population is increasing beyond the general population increase.
Data: City-Wide
The other, often neglected, reality is that the gains in the urban cores are small compared to overall city (urban area or metropolitan area) trends. And millennial urban core gains may well have reached a peak, as has been suggested by Trulia’s Jed Kolko. Over the last year the millennial population in the CBDs has dropped a modest 25,000 (an amount that is probably within the margin of error, since all of these data are from surveys).
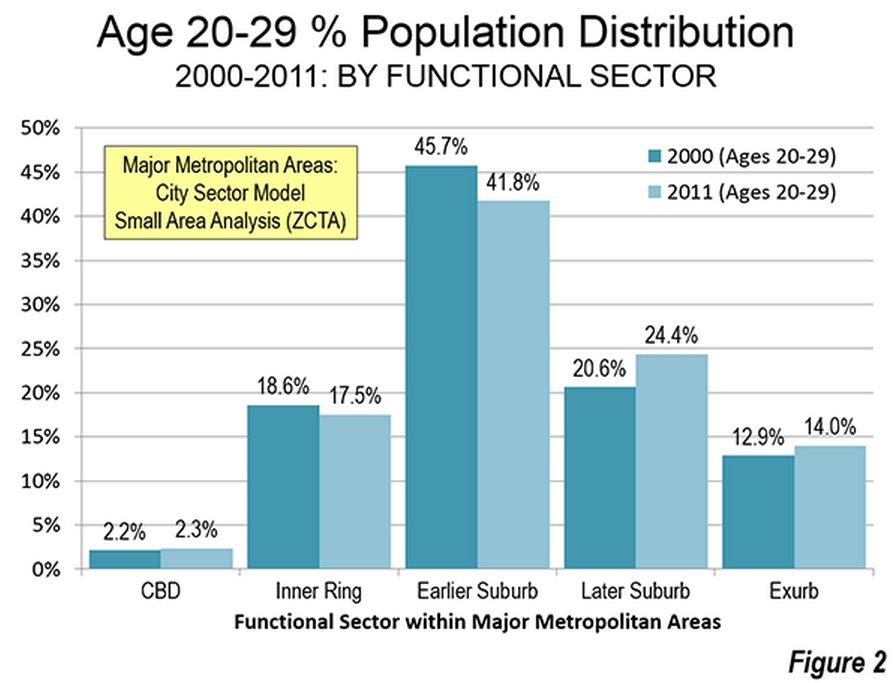
Only 2.3% of millennials lived in the CBDs in the most recent year for which there is data (2011). This is up, but only from 2.2% in 2000. That gain was offset by a troubling loss in the inner core from 18.6% to 17.5%. The millennial share increases were all in the suburbs and exurbs (Figure 2).
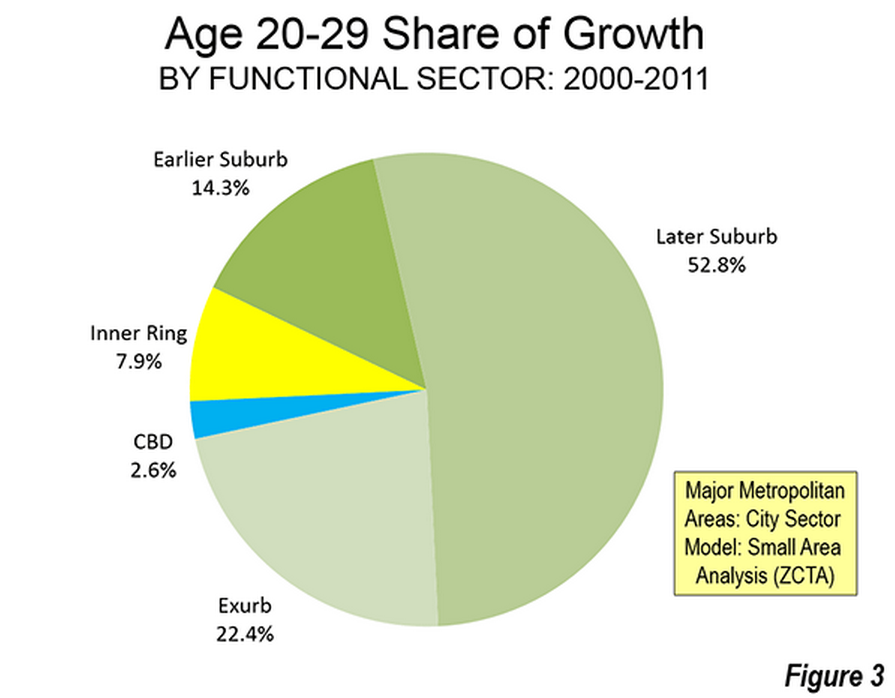
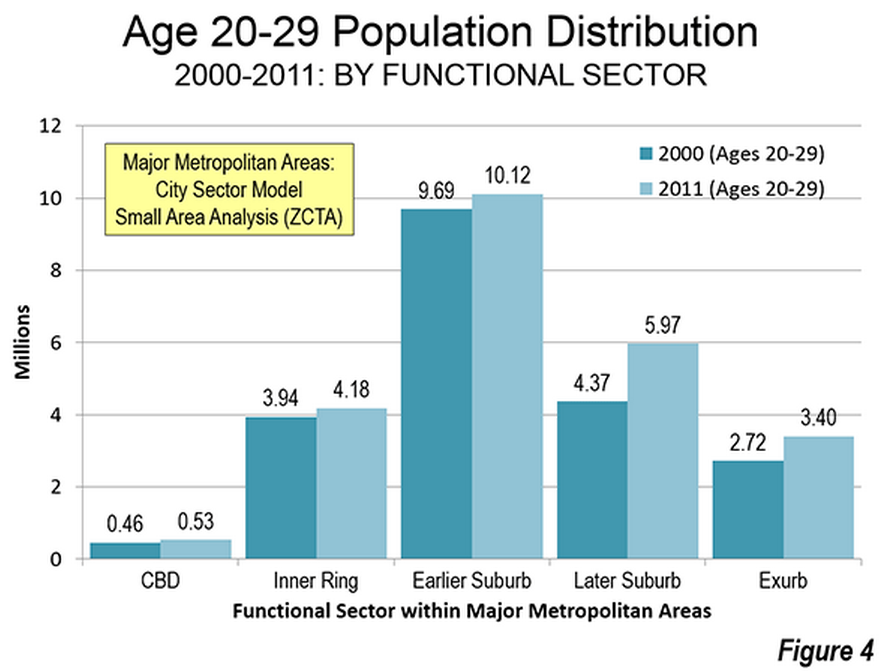
In numbers, the population aged 20 to 29 increased in the suburbs 20 times that of the CBD and the increase in the exurbs was nearly 9 times as high. Altogether, more than 90% of this cohort’s growth took place outside the urban core in the major metropolitan areas (Figure 3). Overall, the millennial gains in the CBD were approximately 80,000, while the gains in the inner ring were approximately 240,000. By contrast, the millennial gains in the suburbs and exurbs amounted to more than 2.75 million (Figure 4).
A Matter of Perspective
The story on millennials is simply a matter of perspective. Those most interested in the small but influential urban core, depict a rising tide of millennials, with some justification. Those most interested in all the entire metropolitan area, are compelled by the overwhelming numbers to recognize that the story of millennials in the urban core is less significant in the larger context. But we are far from, and may well never achieve, a return to the imminent “Nirvana” of restoring pre-World War II cities or even a substantially smaller role for cars, which continue to drive the urban form in much of the world.
Continued progress in the urban cores does not depend upon the “death” or decline of the suburbs. If cities are to best perform their crucial role of providing better standards of living and enabling lower poverty rates, they could boost prosperity throughout the city from the urban core through the suburbs to the exurbs.
Note: ACS 5 Year Data: The data were collected by the American Community Survey of the US Census Bureau from 2009 to 2013. One fifth of the survey is completed each year, and therefore the data most closely approximates the middle of the period, 2011.
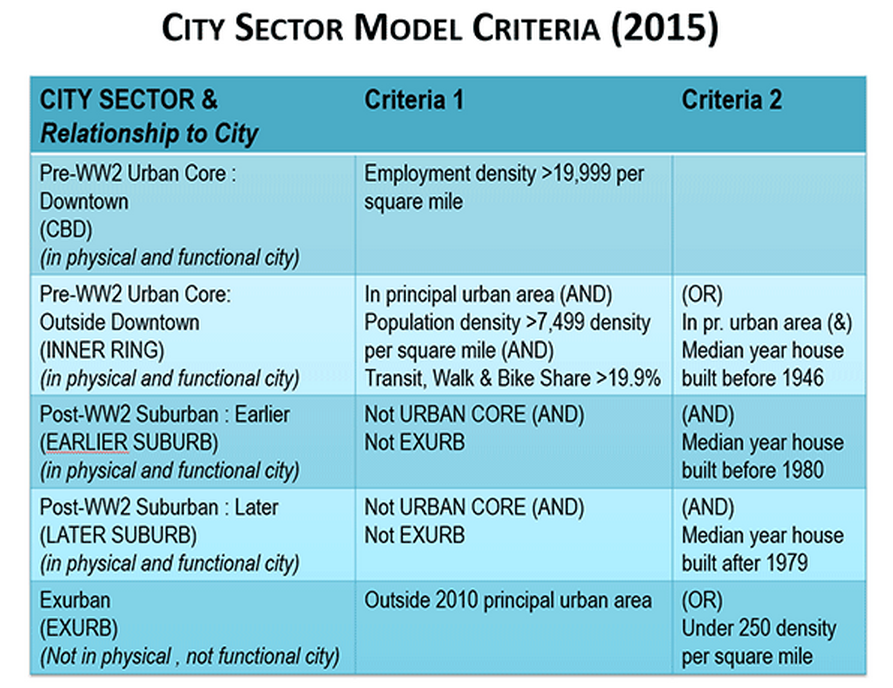
Note: City Sector Model Criteria: This article continues a series examining the 52 major metropolitan areas (those with more than 1,000,000 residents) using the City Sector Model, which allows a more representative functional analysis of urban core, suburban, and exurban areas, by using smaller areas, rather than using municipal boundaries. The City Sector Model thus eliminates the over-statement of urban core data that occurs in conventional analyses, which rely on historical core municipalities, most of which encompass considerable suburbanization.
The City Sector Model classifies 9,000 major metropolitan area zip code tabulation areas using urban form, density, and travel behavior characteristics. There are five functional classifications: the CBD, the inner ring, all will earlier suburbs, later suburbs, and exurban areas.
The general criteria is as follows: The CBDs include any small area with an employment density of 20,000 or more per square mile. The inner ring has lower employment density, with high residential densities, older housing and substantially greater reliance on transit. The CBD and inner ring together form the urban core, which resembles the population density and travel patterns of the pre-World War II city. The suburbs constitute the balance of the built-up urban areas and the exurbs are beyond the built-up urban areas.
The revised City Sector Model criteria are illustrated in the Figure: “City Sector Model Criteria: 2015,” below.
Wendell Cox is principal of Demographia, an international public policy and demographics firm. He is co-author of the “Demographia International Housing Affordability Survey” and author of “Demographia World Urban Areas” and “War on the Dream: How Anti-Sprawl Policy Threatens the Quality of Life.” He was appointed to three terms on the Los Angeles County Transportation Commission, where he served with the leading city and county leadership as the only non-elected member. He was appointed to the Amtrak Reform Council to fill the unexpired term of Governor Christine Todd Whitman and has served as a visiting professor at the Conservatoire National des Arts et Metiers, a national university in Paris.
