10 MOST AFFLUENT CITIES IN THE WORLD: MACAU AND HARTFORD TOP THE LIST
by Wendell Cox 02/21/2015

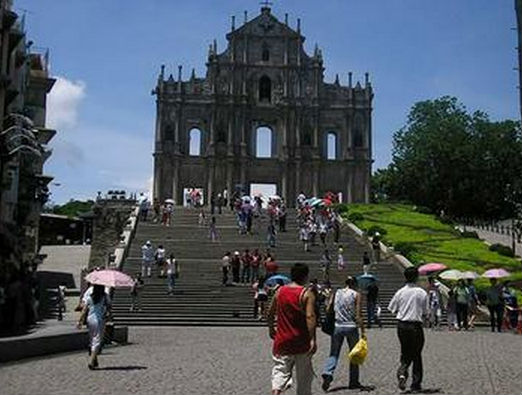
St. Paul’s Church (Facade), Macau, photo by authors
The United States and Europe continue to dominate the list of strongest metropolitan areas (city) economies in the world, according to the Brookings Institution’s recently released Global Metro Monitor 2014.This is measured by gross domestic product per capita, adjusted for purchasing power parity (GDP-PPP). Brookings points out that this does not indicate personal income, but “proxies the average standard of living in an area.”
The Global Metro Monitor 2014 provides detailed ratings for the 300 largest metropolitan economies in the world, measured by gross domestic product adjusted for purchasing power parity. The list is defined by total size of the economy, with some cities with very high GDP-PPPs per capita, but small populations are excluded. For example, Midland, Texas, with the highest GDP-PPP per capita metropolitan area according to the United States by the Department of Commerce Bureau of Economic Analysis, is excluded. Other cities, with large populations and low GDP-PPP s per capita were included, such as megacity Kolkata, with a GDP-PPP of $4,000, a fraction of the top 10 average of $77,000. Megacities such as Lagos, Dhaka and Kinshasa were excluded from the top 300, owing to their low GDP-PPPs per capita
According to data in the Global Metro Monitor website and report, 90 of the top 100 cities were in the United States or Europe in 2014, 68 in the United States and 20 in Europe. The US figure matches that of the previous Global Metro Monitor (2012), while Europe has fallen from 22 to 20 cities.
Macau: The Most Affluent City
Last year’s most affluent city, Hartford, was replaced by Macau, which, with Hong Kong is one of China’s two special economic regions. Brookings estimates Macau’s GDP-PPP per capita at $93,849, opening a substantial lead on Hartford of more than $10,000.
Macau’s economy has expanded rapidly the last decade, principally due to legalized gaming industry and related tourism. Macau displaced Las Vegas as the largest gaming center in 2006. According to the Las Vegas Review Journal, Macau’s gaming revenues had exploded to nearly seven times that of the Las Vegas Strip ($44.1 billion compared to $6.4 billion). Revenue declined, however, in 2014, partly due to China’s anti-corruption drive and competition from other growing East Asian centers, such as Singapore and the Philippines.
Macau is the one of the smallest cities in the Brookings 300, with a population of only 575,000. Only three other richest cities have populations less than 600,000 including Durham, North Carolina the smallest, ranked 12th, Pennsylvania’s capital, Harrisburg (with a core city that filed for bankruptcy), ranked 25th and Scotland’s capital, Edinburgh, at ranked 37th.
Balance of the Top 10 Cities
As was the case last year, nine of the 10 largest GDP-PPP’s per capita were in the United States (Figure). Like Macau, the second and third ranking cities were also smaller than the average, a population of 4.7 million. Second ranked Hartford, with a GDP-PPP per capita of $83,100 has 1.1 million residents. Hartford’s economy strong in finance, especially insurance and benefits and is an important government center, as the capital of Connecticut.
 San Jose, with 1.9 million residents, ranked third, with a GDP-PPP per capita of $82,400. San Jose is home to the larger part of the world’s leading technology center, suburban Silicon Valley. Tech and University hub Boston ranked fourth.
Leading energy hub Houston ranked as the fifth most affluent city, with a GDP-PPP per capita of nearly $75,000 (Note 1). With 6.4 million residents, Houston is the largest city among the top five. Among the top ten, only New York is larger.
Bridgeport, Connecticut, a metropolitan area adjacent to New York that includes suburban business centers such as Stamford, Westport and Greenwich is ranked 6th.
The balance of the top 10 also includes cities specializing in technology, finance and government. Number seven Washington has probably the world’s largest government complex and has nurtured a huge technology center centered in the Virginia and Maryland suburbs. Seattle ranks eighth, continuing its historic leadership in the technology driven aerospace industry besides its emergence as one of leading information technology centers in the world.
San Francisco which includes part of the Silicon Valley in its suburbs (sharing with San Jose) and has a strong social media industry in its urban core, ranks 9th. The top 10 was rounded out by New York, perennially ranked as one of the two top global cities, along with London (see: Size is not the Answer: The Changing Face of the Global City, referred to as the Global Cities Report, described further in Note 2)
Additional Highlights
Europe:Unlike the United States, which placed 37 of its most affluent cities in the top 50 and 31 in the second 50, Europe’s 20 most affluent economies were concentrated in the second 50, with only six in the top 50. Comparatively small Edinburgh, cited above, was the most affluent, at 37th. Paris was ranked 40th most affluent by Brookings and 3rd in the Global Cites report, just ahead of London at 42nd, the perennial global city co-leader (which was ranked number one in the Global Cities Report).
Hong Kong:Along with Macau, China’s other special economic region, Hong Kong continued to be among the world’s most affluent, at 39th. The Global Cities Report ranked Hong Kong as the sixth Global City, with a GDP-PPP PPP higher than that of former its former imperial capital London.
China: Perhaps most significantly, mainland China has begun to enter the top 100. Suzhou, partly exurban to Shanghai (Kunshan), now ranks 68th. Suzhou has been the recipient of considerable business park investment, including cooperative ventures with Singapore. China’s economic prosperity may be shifting toward the Yangtze Delta (which extends from Ningbo and Hangzhou, through Shanghai to Nanjing). Along with Suzhou, Wuxi, Changzhou and Nanjing now have GDP-PPP’s per capita exceeding $30,000. By contrast, among the large manufacturing centers of the Pearl River Delta, only Shenzhen exceeds a GDP-PPP of $30,000, while Guangzhou, Dongguan and Foshan are below that level (Note 2). According to a new Economist Intelligence Unit report, Jiangsu (which includes the urban corridor from Suzhou to Nanjing) now accounts for more manufacturing employment than any other province.
Surprisingly Low Rankings:
Some cities that might have been expected to be among the world’s most affluent, ranked comparatively low. For example Tokyo, the world’s largest city, ranked fourth in the Global Cities Report, made it only to the third 50 in affluence. Seoul-Incheon, a burgeoning corporate and tech center, remained outside the top 100.
Canada’s largest city, Toronto managed only a ranking of 100, well below the Prairie behemoths of Calgary (11th) and Edmonton (23rd). Australia’s largest city, Sydney also barely made the top 100, at 95th, far below energy and commodities capital Perth (17th).
European cities with reputations for unusual prosperity also ranked lower than expected. Financial center Zurich was ranked 45th. Scandinavia’s most affluent city was Stockholm (48th), followed by energy leader Oslo (62nd), Helsinki (87th) and Copenhagen, which failed to make the top 100 and ranked in the third 50. Singapore,which the Global Cities Report ranks fourth, is ranked 14th most affluent.
Evaluating City Performance
Cities grow as migrants are attracted by hope for better lives. This is as true in Africa and India as it is in Europe or the United States. Cities achieve their primary purpose when they produce a higher standard of living for their residents. Some cities do very well at this, as the Brookings data indicates, and some do less well. The Global Metro Monitor provides crucial information that can be used by national, regional and local officials to measure how well their policies are performing in improving living conditions in relation to both their own past and other cities.
Note 1: Purchasing power can vary greatly even within nations. Because of this, the United States Department of Commerce, Bureau of Economic Analysis has developed a regional price parities (RPP) program to adjust for metropolitan area costs of living. For example, in 2012, the unadjusted per capita income in San Jose was 30 percent above that of Houston. In the same year, the per capita income-RPP (or in international terms, the per capita income-PPP) in San Jose was just six percent above that of Houston, indicating cost of living at least 20 percent higher in San Jose.
Note 2: Joel Kotkin was principal author of Size is not the Answer: The Changing Face of the Global City, which included contributing authors Ali Modarres, Aaron M. Renn and me. Thereport was jointly published by the and Chapman University. The report is available here.
Note 3: The 2012 Global Metro Monitor ranked some cities of China higher, though Note 19 expressed concerns about population data for some cities, which might have excluded migrant populations (the “floating population”). There are no such difficulties in the 2014 Global Metro Monitor.
Wendell Cox is principal of Demographia, an international public policy and demographics firm. He is co-author of the “Demographia International Housing Affordability Survey” and author of “Demographia World Urban Areas” and “War on the Dream: How Anti-Sprawl Policy Threatens the Quality of Life.” He was appointed to three terms on the Los Angeles County Transportation Commission, where he served with the leading city and county leadership as the only non-elected member. He was appointed to the Amtrak Reform Council to fill the unexpired term of Governor Christine Todd Whitman and has served as a visiting professor at the Conservatoire National des Arts et Metiers, a national university in Paris.


