
Anti-“Sprawl” Bay Area Leads Expanding Metropolitan Regions
The continuing expansion of metropolitan regions is indicated by the latest geographical delineations from the Office of Management and Budget (September 2018). This article examines metropolitan regions based on these boundaries, providing population figures, as well as highlighting significant changes and updates the analysis provided in 2015. It illustrates that, despite the desires of planners and environmentalists to limit “sprawl”, labor markets continue to expand their footprint, particularly in the most regulated regions such as the Bay Area.
For the purposes of this analysis, a metropolitan region is either a ‘combined statistical area (CSA)” or a “metropolitan area” (MSA), including “micropolitan areas,” a term given to smaller metropolitan areas. Combined statistical areas are two or more adjacent metropolitan areas that have “substantial employment interchange.” Combined statistical areas can be comprised of more than two CSA’s.
Among the 61 metropolitan regions with more than 1,000,000 residents, only four are not CSA’s, San Diego, Tampa-St. Petersburg, Austin, and Richmond, where there are no adjacent metropolitan regions that are sufficiently integrated economically to form a CSA. This is down from six just three years ago, as expanding commuting trends have made two more CSA’s out of major MSA’s. They are Phoenix and San Antonio, which have added counties (Note 1).
In 2017, there were 558 metropolitan regions in the United States. The table below provides data on those with more than 500,000 residents. There is a complete table of the 558 metropolitan regions at www.demographia.com/db-mr2017.pdf.
Distribution of Population Growth
The distribution of population is indicated by population category in Figure 1. Nearly one quarter of the nation’s population lives in the 10 metropolitan regions with between 5,000,000 and 9,999,999 million residents. Those with a population from 1,000,000 to 2,499,999 residents garner 17 percent, while those from 2,500,000 to 4,999,999 residents account for 14.6 percent of the population. The megacities, with over 10,000,000 residents (New York and Los Angeles) have only 12.8 percent of the residents. However, the two megacities are likely to have company soon, with Washington-Baltimore’s growth rate on track for 10 million by the 2020 census, a level that should be reached by San Jose-San Francisco by the middle 2020s. By the mid 2030s, Chicago, Dallas-Fort Worth and Houston should exceed 10 million. By that time, based on 2010 to 2017 growth trends, there would be seven megacities, up from two, and Chicago would rank as the smallest megacity. Of course, recent trends are not necessarily predictive of the future.
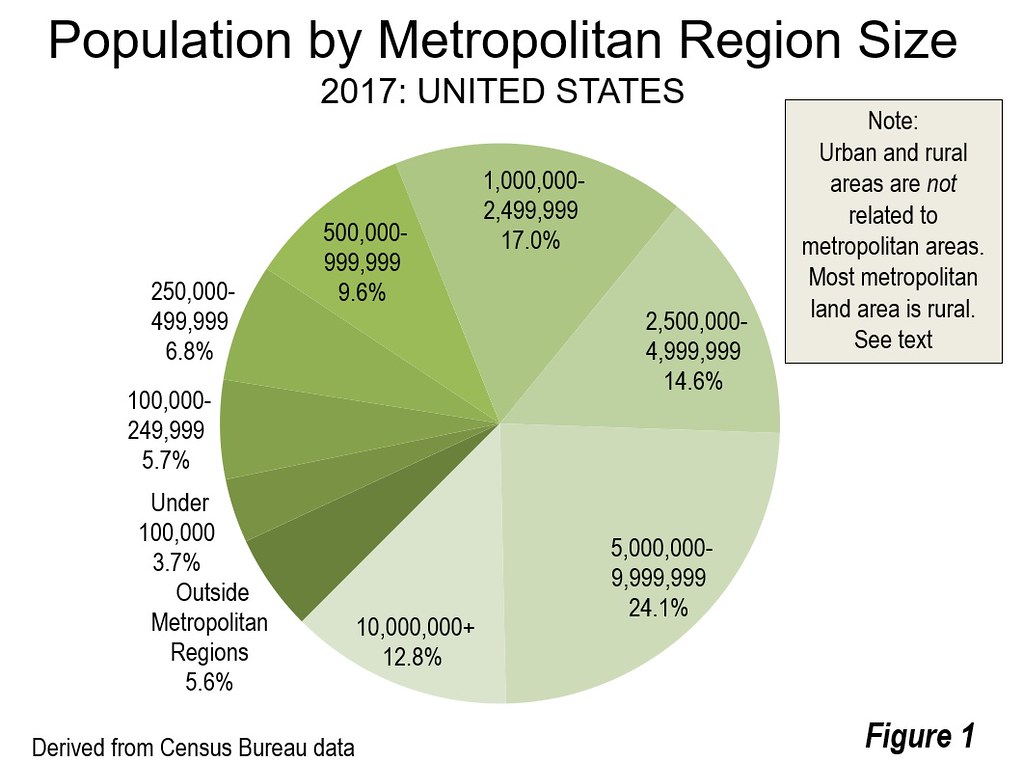
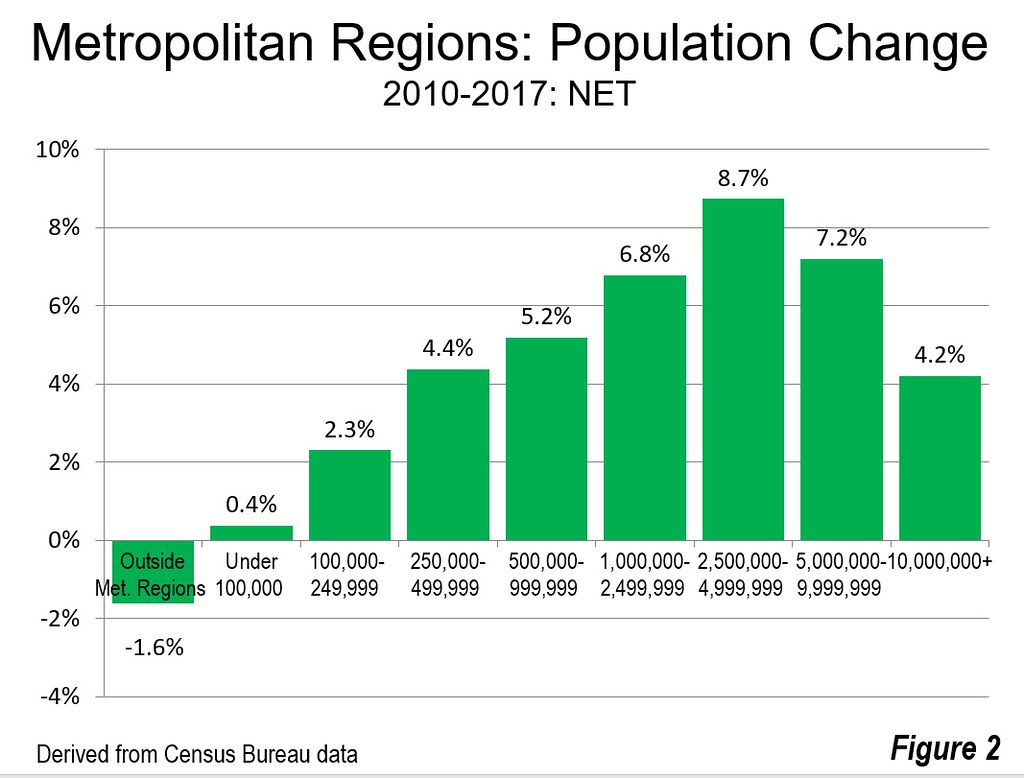
Between 2010 and 2017, the greatest growth was among metropolitan regions in areas with between 2,500,000 to 4,999,999 residents, which at 8.2 percent was more than one-half greater than the 5.5 percent national growth rate. Metropolitan regions with 5,000,000 to 9,999,999 population and those with 1,000,000 to 2,499,999 population also grew faster than the national growth rate. Among population categories of 250,000, and over, the slowest growth rate was in the two megacities, New York and Los Angeles. Areas outside the metropolitan regions lost 1.6 percent. Metropolitan versus non-metropolitan is not the same as urban versus rural (Note 2).
Rank Order Changes
There have been a number of rank-order changes over the period (based on the current geographical delineations). Dallas-Fort Worth has supplanted Philadelphia in 7th place. In 2010 Dallas-Fort Worth trailed Philadelphia by 180,000, but now leads by nearly 600,000.
Houston has displaced Miami, to assume 9th place. In 2010 Houston trailed Miami by more than 100,000, but now leads by 200,000. Both metropolitan regions are growing quickly, Miami at nearly double the national rate and Houston at nearly triple.
Phoenix and Seattle have been growing at more than double the national rate. However, slightly faster growth in Phoenix enabled it to become the 13th largest metropolitan region, passing Seattle. Phoenix is the third largest metropolitan region in the 13 western states behind only the Los Angeles and Bay Area.
Orlando moved up two positions, from 17th to 15th, passing Minneapolis-St. Paul and Cleveland-Akron. Denver moved ahead of San Diego, to assume 18th place. Tampa-St. Petersburg passed St. Louis in 21st place. Charlotte advanced two positions to 23rd, passing Pittsburgh and Sacramento. Salt Lake City gained two places, passing Columbus and Kansas City.
The largest rank-order changes gains were in Cape Coral, Florida, up six positions from 60th to 54th. Three metropolitan regions gained four positions, including San Antonio (from 31st to 27th), Austin (from 37th to 33rd), and North Port-Sarasota (65th to 61st).
San Francisco Metropolitan Region Expands
The San Francisco Bay area (San Jose-San Francisco) continued to expand its commuting shed, the regional planning disdain for “sprawl”, adding territory for the second time in the decade. Ironically, this has been driven by the extraordinary house price increases and land use regulation that bans new suburban subdivisions in undeveloped areas closest to the largest jobs centers.
The previous expansion had been to Stockton (San Joaquin County). Now Modesto (Stanislaus County) and Merced (Merced County) have been added to the Bay Area. The draw of the added areas is the lower cost of living, driven by lower housing costs. Even so, in Merced County, the most distant from San Francisco in the metropolitan region, housing is severely unaffordable, at a Median Multiple of 6.0 (median house price divided by median household income). This is worse than New York (5.5) and Seattle (5.6).
The addition of Merced County enlarges the San Francisco Bay Area metropolitan region to within 40 miles of the Fresno city limits. The San Francisco Bay area metropolitan region now covers 13,600 square miles (35,000 square miles), with the two new counties adding 3,500 square miles (9,000 square kilometers). The Bay Area metropolitan region covers 270 times the land area of the city of San Francisco.
The San Francisco expansions mirror developments in other markets, such as Portland and Seattle, where severely unaffordable housing polices — which are designed to slow “sprawl” — has driven expansion of the metropolitan regions. For example, the Portland and Seattle metropolitan regions combined form an unbroken line along Interstate 5 from Anacortes, Washington to Corvallis, Oregon, a distance of more than 300 miles (500 kilometers).
Continuing Dispersion
The continuing geographic expansion of America’s metropolitan regions reinforces market preferences for houses at a price that can be afforded by middle-income households. For all the concerns of planners and radical environmentalists, their best laid plans are undone and distorted by market forces and customer preferences.
Note 1: The large building blocks (counties) used by OMB in defining metropolitan areas are a principal reason for this. Metropolitan areas adjacent to larger metropolitan regions can be “blocked” from expansion. For example, southwestern Riverside County, in the Los Angeles CSA, includes many commuters to the San Diego metropolitan area, such as from the Temecula and Murrieta. However since Riverside county is in the Los Angeles CSA, the southwestern part of the county is considered more economically tied to Los Angeles, rather than to San Diego. However, the ties to San Diego in southwestern Riverside County may be greater than to Los Angeles. Tampa-St. Petersburg has a similar problem with adjacent Orlando. It seems likely that Polk County (Lakeland), which is assigned to Orlando, would be split between the two metropolitan regions if smaller areas were used in delineating metropolitan areas. So too in Austin, with Comal County classified in San Antonio, but its position midway between the two core municipalities suggests that Austin is a greater draw for commuters at least in the north.
Note 2: Areas outside metropolitan regions are different than rural areas (See The Rural Character of Metropolitan Areas). Most of the land area in metropolitan regions is rural and it classified as metropolitan based on the extent of commuting to nearby “central” counties (which are defined by urban areas, as opposed to core cities).
Photo credit: Amadscientist via Wikimedia under CC 3.0 License
Wendell Cox is principal of Demographia, an international public policy and demographics firm. He is a Senior Fellow of the Center for Opportunity Urbanism<;(US), Senior Fellow for Housing Affordability and Municipal Policy for the Frontier Centre for Public Policy (Canada), and a member of the Board of Advisors of the Center for Demographics and Policy at Chapman University (California). He was appointed to three terms on the Los Angeles County Transportation Commission, where he served with the leading city and county leadership as the only non-elected member. During that time, he authored the amendment that created the Proposition A 35% set aside that established the first local funding for the rail system. His involvement on the Commission is detailed in Transit in Los Angeles.

