
Three Studies That Show Density Doesn’t Determine Car Travel
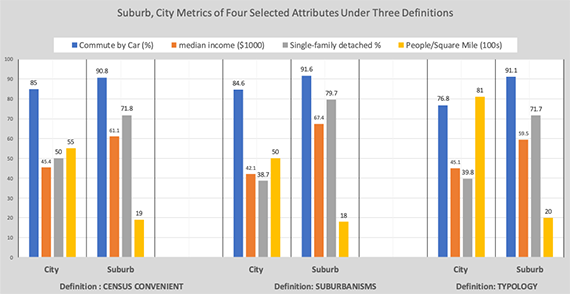
Fig. 1 How Three Definitions of “city” and “suburb” affect the metrics of their characteristics.
These three works cover the gamut of geography: from international cities to U.S. urbanized areas to 60,000 census tracts and to specific community developments. In these works, we look at findings that relate specifically to the question of density and its association to commuting by car. This geographic range allows assumptions to be tested at all levels (theory to practice) and all scales (regional to local).
Expected Differences and a Surprising Similarity
A paper by the Joint Center for Housing Studies of Harvard University sets out to determine how three distinct definitions of “city” and “suburb” affect the outcomes of analyses and, ultimately, the quantitative representation of their characteristics. It offers an opportunity to examine any one of 29 characteristics (covering economic, socio-demographic and physical) using a large statistical base.
Figure 1, shows this intent with a subset of only four characteristics. For example, “city” density (yellow) varies between 5,000 to 8,100 people per square mile under the respective definitions. By contrast, “suburban” density varies less: from 1,800 to 2000 people per square mile. The large (60%) difference in “city” density between the first two and third definition is surprising but explainable in that ‘city” in this definition represent the city core only, usually small in area and very dense.
Differences between “city” and “suburb” within a definition (e.g., Census Convenient) for some characteristics are pronounced and, in most cases, expected. For example, Median Income ($45,00 vs $61,100) and percent of Single-Family Detached (50% vs 71.8%) offer no surprises. The surprise, and the first signpost in our travel, appears in the rate of Commute-by-Car. This counterintuitive statistic becomes clearer in Fig 2.
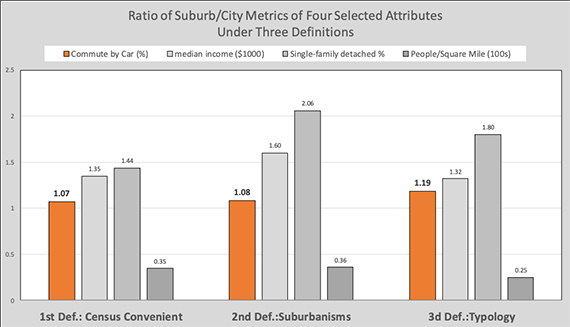
Fig. 2 Ratios of metrics for four characteristics between “suburb” and “city” under three definitions.
Figure 2 shows the ratios of city to suburb metrics for the same four characteristics under the three definitions. For 27 of 29 characteristics, across all definitions, examined in the study, the lowest ratio between city and suburb is for “Commuting-by-Car.” No matter how you define these two distinct built environments, commuting by car varies little between cities and suburbs. The noticeable difference (1.19 ratio) in the third definition is easily understood by the limited geographic delineation of “city” in it – only its core (about a fifth of the metropolitan tracts).
These findings raise doubts about the reflexive perception that “city” residents commute far less by car than their suburban counterparts, and that such an outcome is due to increased density. “We find that density alone explains only a small fraction of the variation in vehicle miles traveled (VMT), and many confounders account for the differences in automobile dependence.” This central finding appears in the Reid Ewing, Shima Hamidi, Guang Tian, David Proffitt (2016) paper Testing Newman and Kenworthy’s Theory of Density and Automobile Dependence commenting on the subject author’s 1989 study.
This 30-year inattention to a sub-set of travel-inducing factors started with a pioneering data collection effort, a thoroughly convincing study and an irresistibly elegant exponential curve, which has been indelibly etched in planners’ minds and in multiple sources. Figure 3 depicts an attempt to show its problematic, apples-and-oranges nature by deconstructing it.
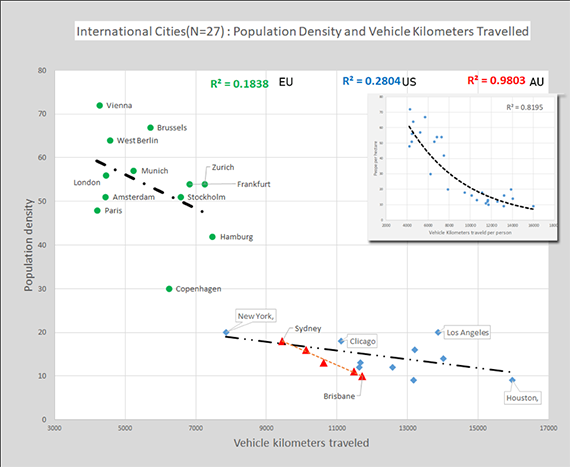
Fig. 3. Deconstructing the Newman/Kenworthy exponential curve into individual constituents.
The city of Copenhagen, for example, has only 60% of Stockholm’s density and less than 50% Brussels’ density, yet it registers nearly identical vehicle kilometers traveled (VKTs). Similarly, across groups, New York has half the density of Hamburg, yet both register similar VKTs. Clearly, other factors lurk behind the overall correlation. “This suggests an apples and oranges problem in the dataset,” say the authors of the above-mentioned paper. Digging further in the available data, my analysis attempted to examine whether structural differences of key geographic city components had an easy-to-discern association with travel.
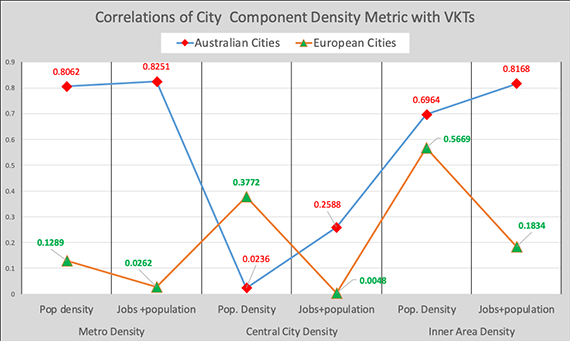
Fig. 4 City geographic component density (Metro, Central City, and Inner Area) and their association with Vehicle Kilometers Traveled.
The image that emerges (Fig. 4) further complicates our pursuit of land use factors that induce travel. For example, jobs+population in Central City (i.e., land use intensity) bears no association to travel for European cities and a weak one for Australian cities. A similar divergence emerges in the land use intensity of the Inner Area: a weak relationship for E.U. cities (R2=0.1834) and a very strong one (R2=0.8168) for Australian cities. Such correlations confound the common perception that Jobs+Density can be a strong positive vector in shaping travel.
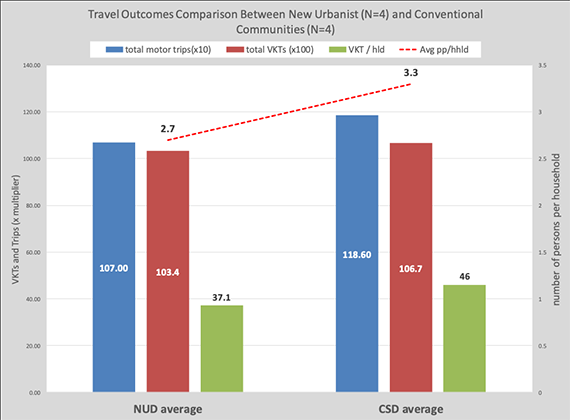
Fig. 5 Comparing travel outcomes of eight selected Canadian communities.
Traces on the Ground
Moving to the scale of individual developments, many projects in the United States and Canada were intentionally designed to be compact and walkable to reduce car use. Tomalty and Heider (2009) carefully selected four such Canadian projects and compared them with four conventional subdivisions in a detailed, thorough study.
The comparison of their physical attributes finds a substantial difference in housing unit density—74% higher in the compact/walkable set, consistent with their intent. Yet, as shown in Fig. 5, the difference in total VKTs between the two sets is insignificant (10,670 vs 10,340). The total car trips and the trips per household, on the other hand, vary noticeably, but the difference mirrors almost exactly the average persons per households in the sets (ratio 1.2)—more people, more trips. This comparison of built communities confirms the second significant finding of the Ewing et al paper: “…We also find that it is not the localized density of individual neighborhoods that causes VMT to be lower in compact urbanized areas but rather the relative accessibility of neighborhoods to the rest of the region.” Evidence from the ground subverts the belief that density is the key factor in predicting car travel.
Travel Log and Lessons
This excursion visited three studies that cover the gamut of geographic scales and a 30-year span of research. Their outcomes, directly or indirectly, speak to the role population density plays in reducing car travel, suggesting that it would be a misrepresentation to portray density as a central vector in determining car travel. Other factors, and there are many, singly or collectively, can have an equal or higher influence on travel outcomes.
Promoting the conviction that simply increasing the density of sporadic developments in a metropolitan region will achieve a reduction in car travel is ill-founded. Travel seems strongly entangled not only with moldable physical attributes, such as density and land use, but also, importantly, with intractable factors, such as personal income, status, perceptions of freedom, household size, employment choice, and stage in life, to name a few. Usually bypassed, such factors, should inform planning in ways that conform not just to a preferred theory but to the far more nuanced reality.
Fanis Grammenos is the director Urban Pattern Associates in Ottawa, Ontario and the author of Remaking the City Grid: A Model for Urban and Suburban Development. Reach him by email with questions or comments.
The original article was first published on Planetizen and this version is reprinted here with thanks.
References:
- Reid Ewing, Shima Hamidi, Guang Tian, David Proffitt (2016): Testing Newman and Kenworthy’s Theory of Density and Automobile Dependence
- Whitney Airgood-Obrycki and Shannon Rieger (2019) Defining Suburbs: How Definitions Shape the Suburban Landscape
- Murtaza Heider, Ph.D. and Ray Tomalty Ph.D: COMPARING CANADIAN NEW URBANIST AND CONVENTIONAL SUBURBAN NEIGHBOURHOODS, Research Report, 2009 CMHC
- Jeffrey R. Kenworthy, Felix B. Laube: Patterns of automobile dependence in cities: an international overview of key physical and economic dimensions with some implications for urban policy, Institute for Science and Technology Policy, Murdoch University
Photo credit: Judgefloro via Wikimedia under Public Domain.

